Loading...

 Scroll for more
From the Super Bowl to 5G
- 01
Introduction

- 02
In athletics, the USA holds the world records

- 03
From an initial idea to the biggest sporting event in America

- 04
From Ford Model T to Tesla

- 05
The consumer attitude towards sustainability

- 06
Is global dominance in MedTech driven by regional population?

- 07
Is growth in the US wireless industry driven by social media?

- 08
In conclusion

- 09
Sources

Introduction
We operate in a dynamic world. Social responsibility shapes how we act; science opens up new ways of thinking; innovation unleashes a whole new set of possibilities; it is often the not-so-obvious that provides the best indicators of our future.
Here, we take a different perspective on the correlations between business and the North American region to find inspiration as to what is possible. We look at sporting achievements, demographic data, business performances, drill down on two rapidly growing sectors - MedTech and 5G - and explore what makes North America successful and what will shape its future.
We aim to provide insights into what drives the megatrends and success and uncover some of the opportunities worth exploring.
In athletics, the USA holds the world records
Click for sound
Is the same true for Entrepreneurial leadership?


World records & entrepreneurial leadership
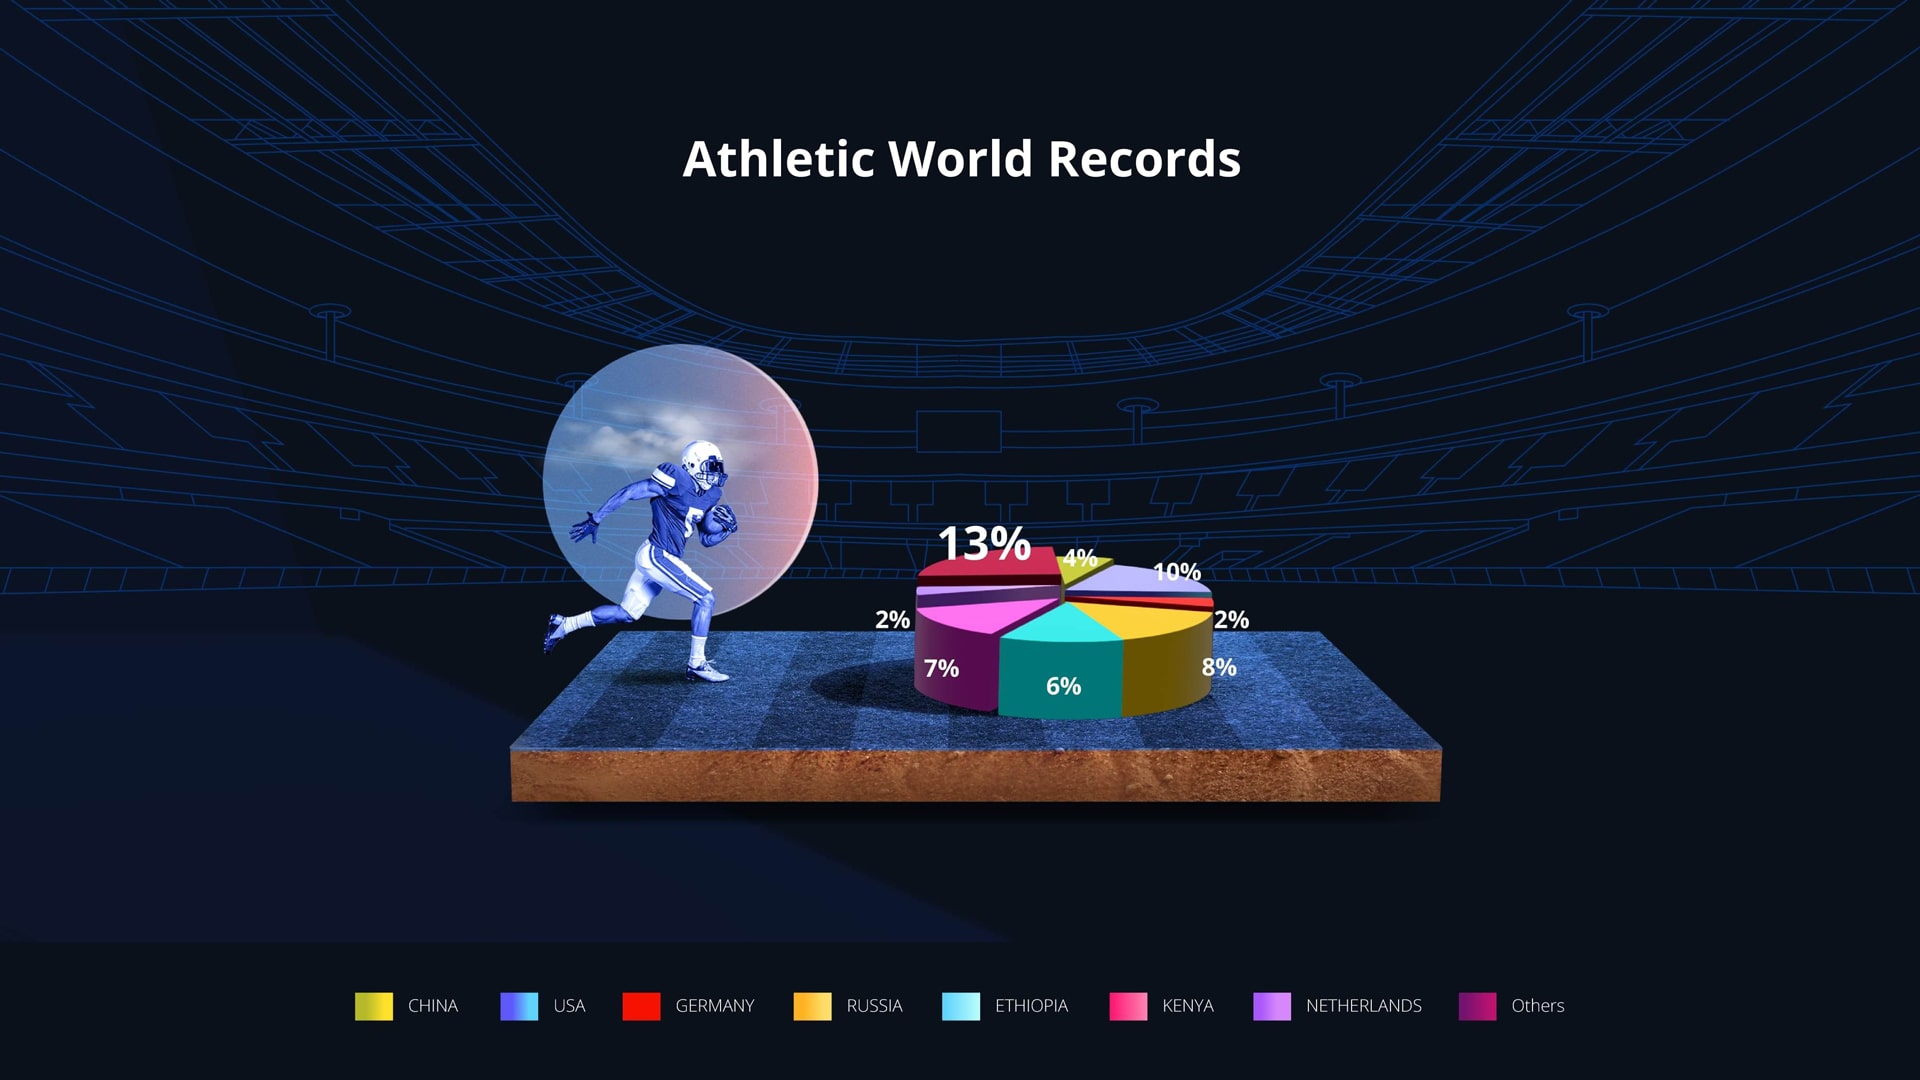
The USA holds 10 of the 52 World Records in Athletics (19%)1; the closest rival is Russia with 8, and only 5 other countries hold 2 or more of these World Records. This shows clear performance dominance and a determination to succeed, but does this correlate to entrepreneurial leadership?
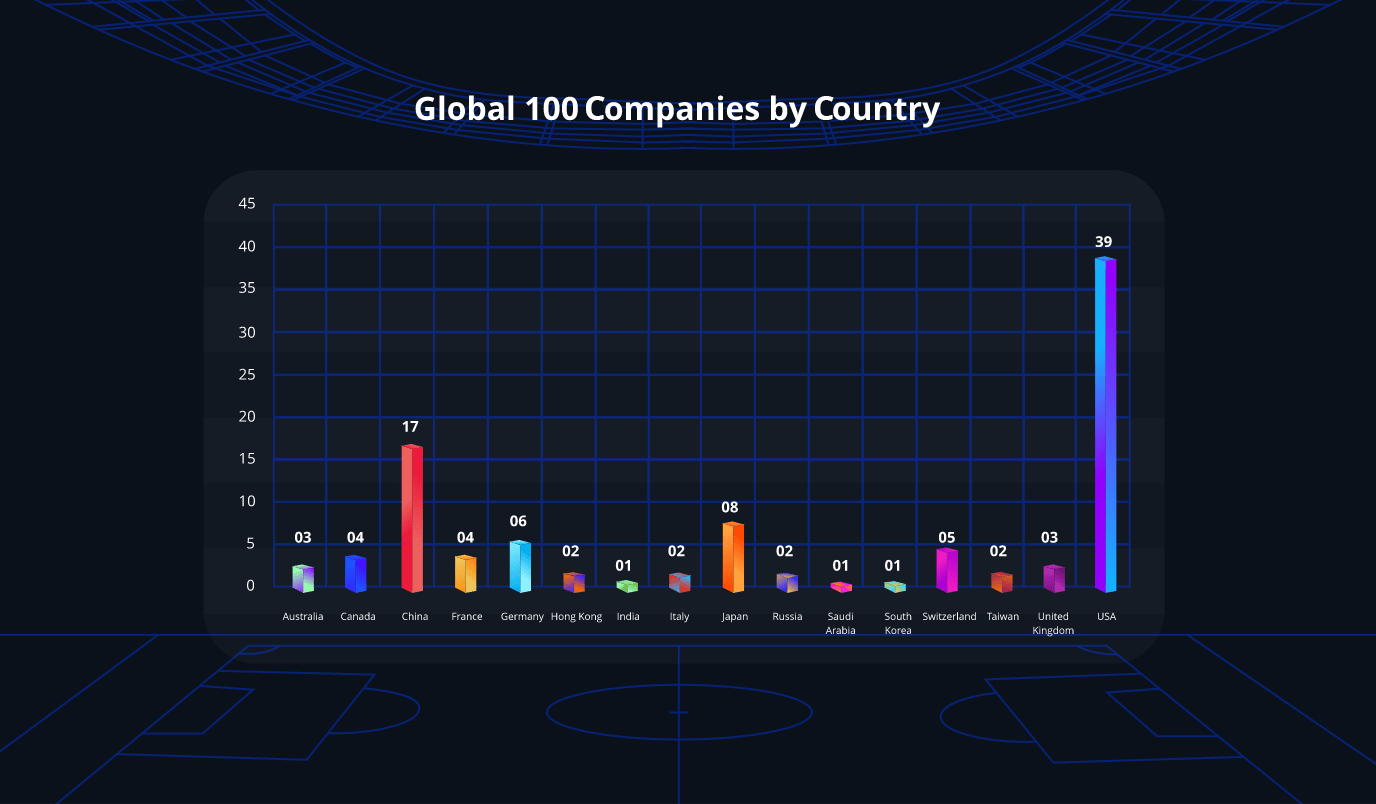
It would suggest so, with the USA outperforming every other country in the Global 100 list of Companies2. It is home to 39 of the top performing global companies, with nearest rival China at 17.
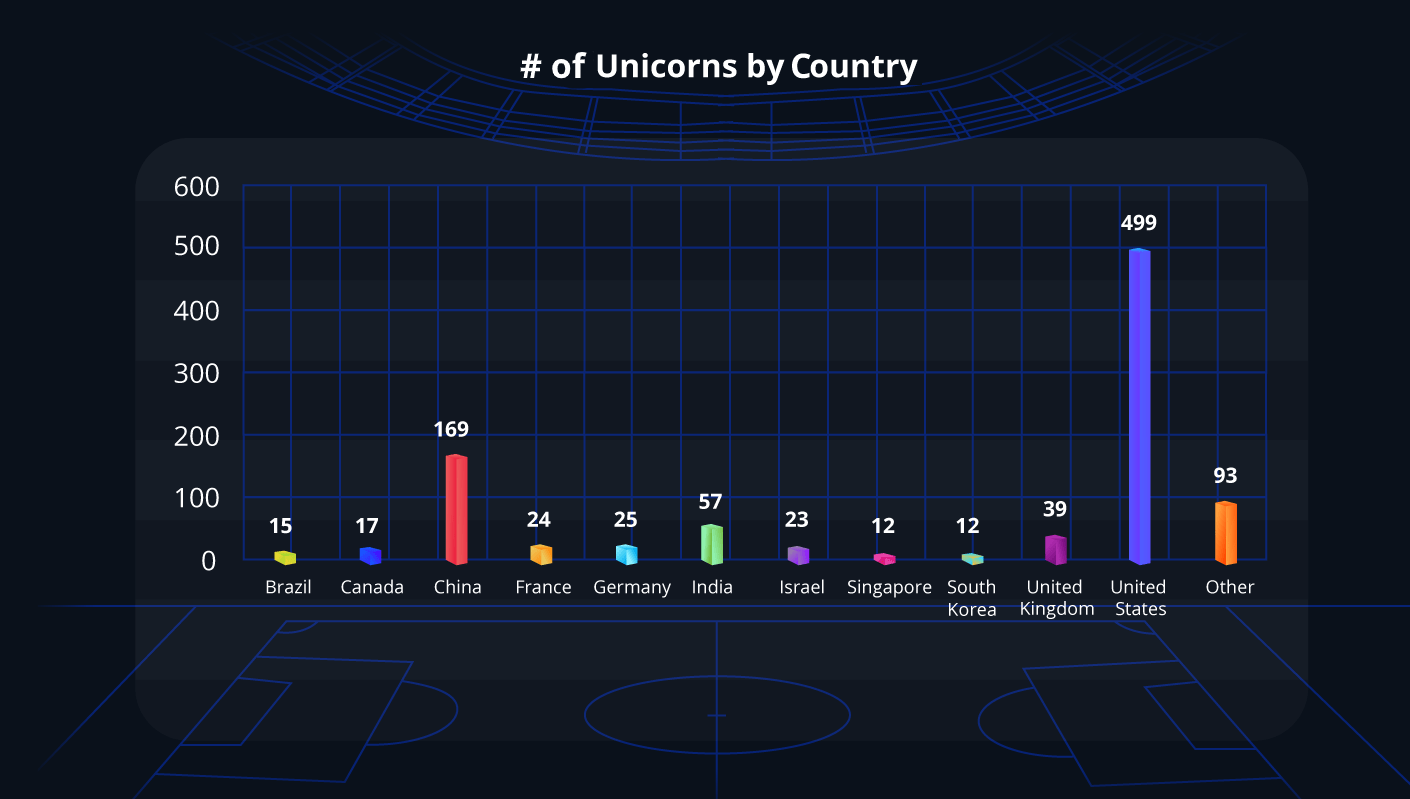
Does this ability to perform originate from investment in talent and innovation - taking ideas and turning them into global success? Let's take a look at the number of Unicorns. We see a direct correlation between the Global 100 performance and the # of Unicorns3, with the USA dominating the Unicorn list with 499 (51%), and the closest rival again being China with 169 (17%).
It is not just the USA driving the entrepreneurial leadership of North America; Canada is one of the only 7 countries with 4 or more companies in the Global 100 list.
From an initial idea to the biggest sporting event in America

Does the Super Bowl show what is possible for entrepreneurial growth?

Comparing the Super Bowl with Silicon Valley
The Super Bowl was founded in 1920, but it was some 40+ years later that the first game was held in 1967. There was no capacity crowd, and the average ticket price was just $12. Fast forward to today, and 91.6 million people watch the Super Bowl on T.V.; every game is a sell-out, and the average ticket price in 2021 was $7,589.8
It is this ability to take a concept and turn it into something truly amazing that fuels the North American economy.
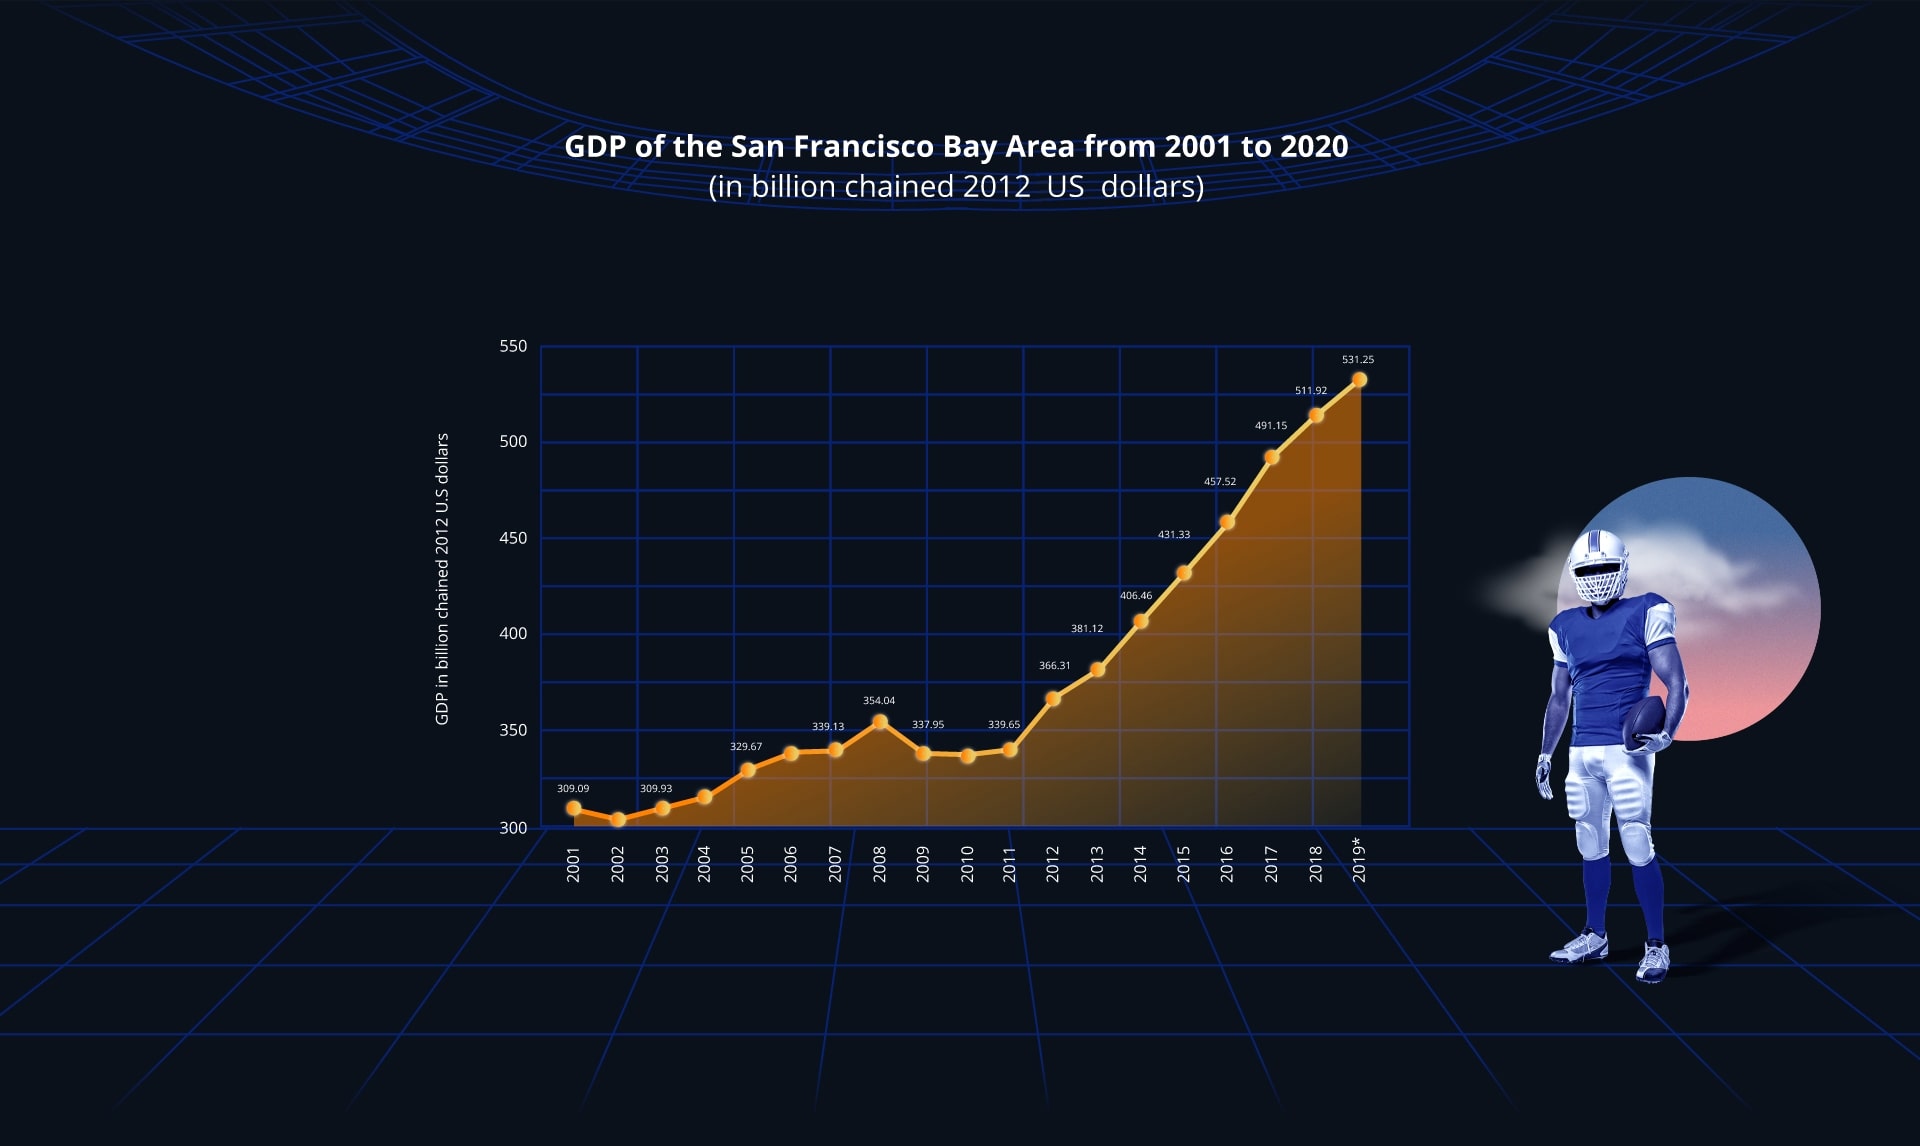
This is shown by the scale of growth of Silicon Valley, which mirrors the development of the Super Bowl. The origins of the Valley date back to the 1950s and the vision of Frederick Terman, the Stanford Dean who created the tradition of the faculty starting their own companies.
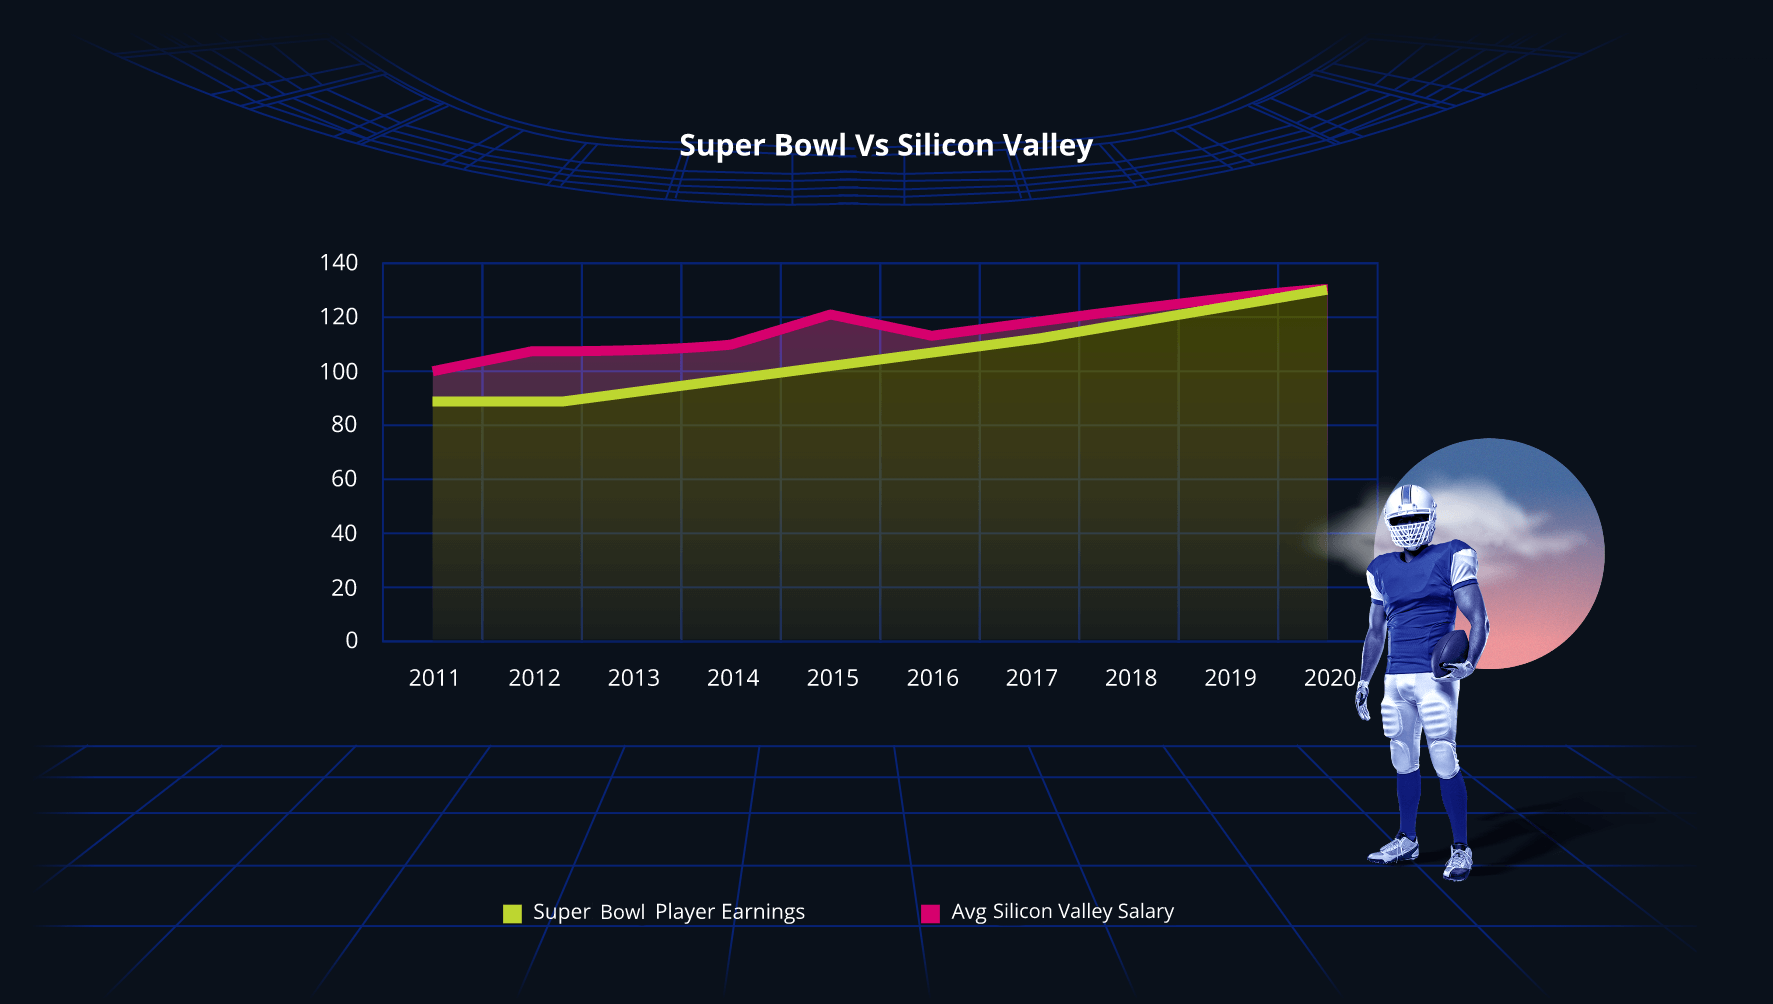
This vision gained momentum in the '70s and '80s with the likes of Atari, Apple, and Oracle being established in the Bay Area. The rest is history with the staggering fact that if Silicon Valley were a country, its per capita GDP would make it the second richest in the world, behind only oil-producing Qatar.
FROM FORD MODEL T TO TESLA
Are we about to
see history repeat itself?
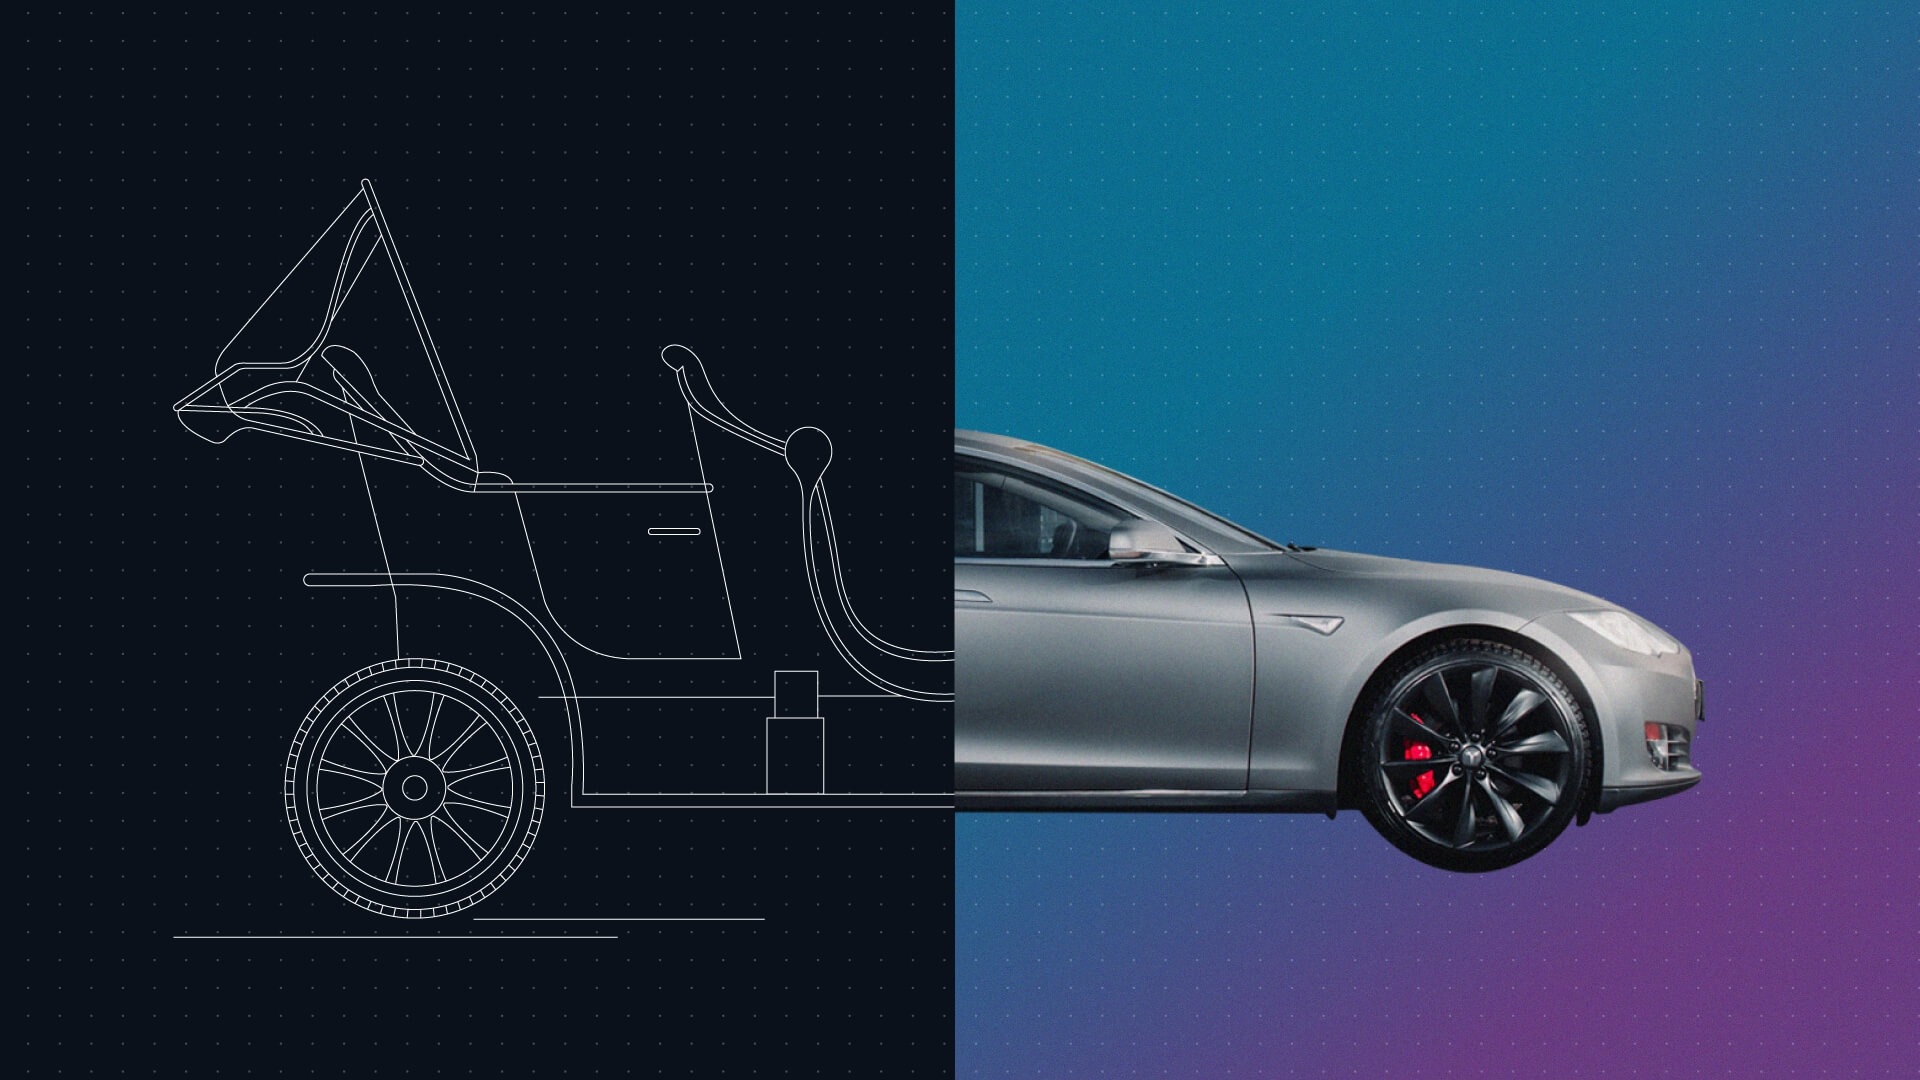
Automotive has a rich and successful heritage in North America. The historical turning point of the industry was the ‘production line’ of the Ford Model T introduced in 1908.
Over a century later, history seems to be repeating itself as Automotive transforms from internal combustion to electric vehicles.
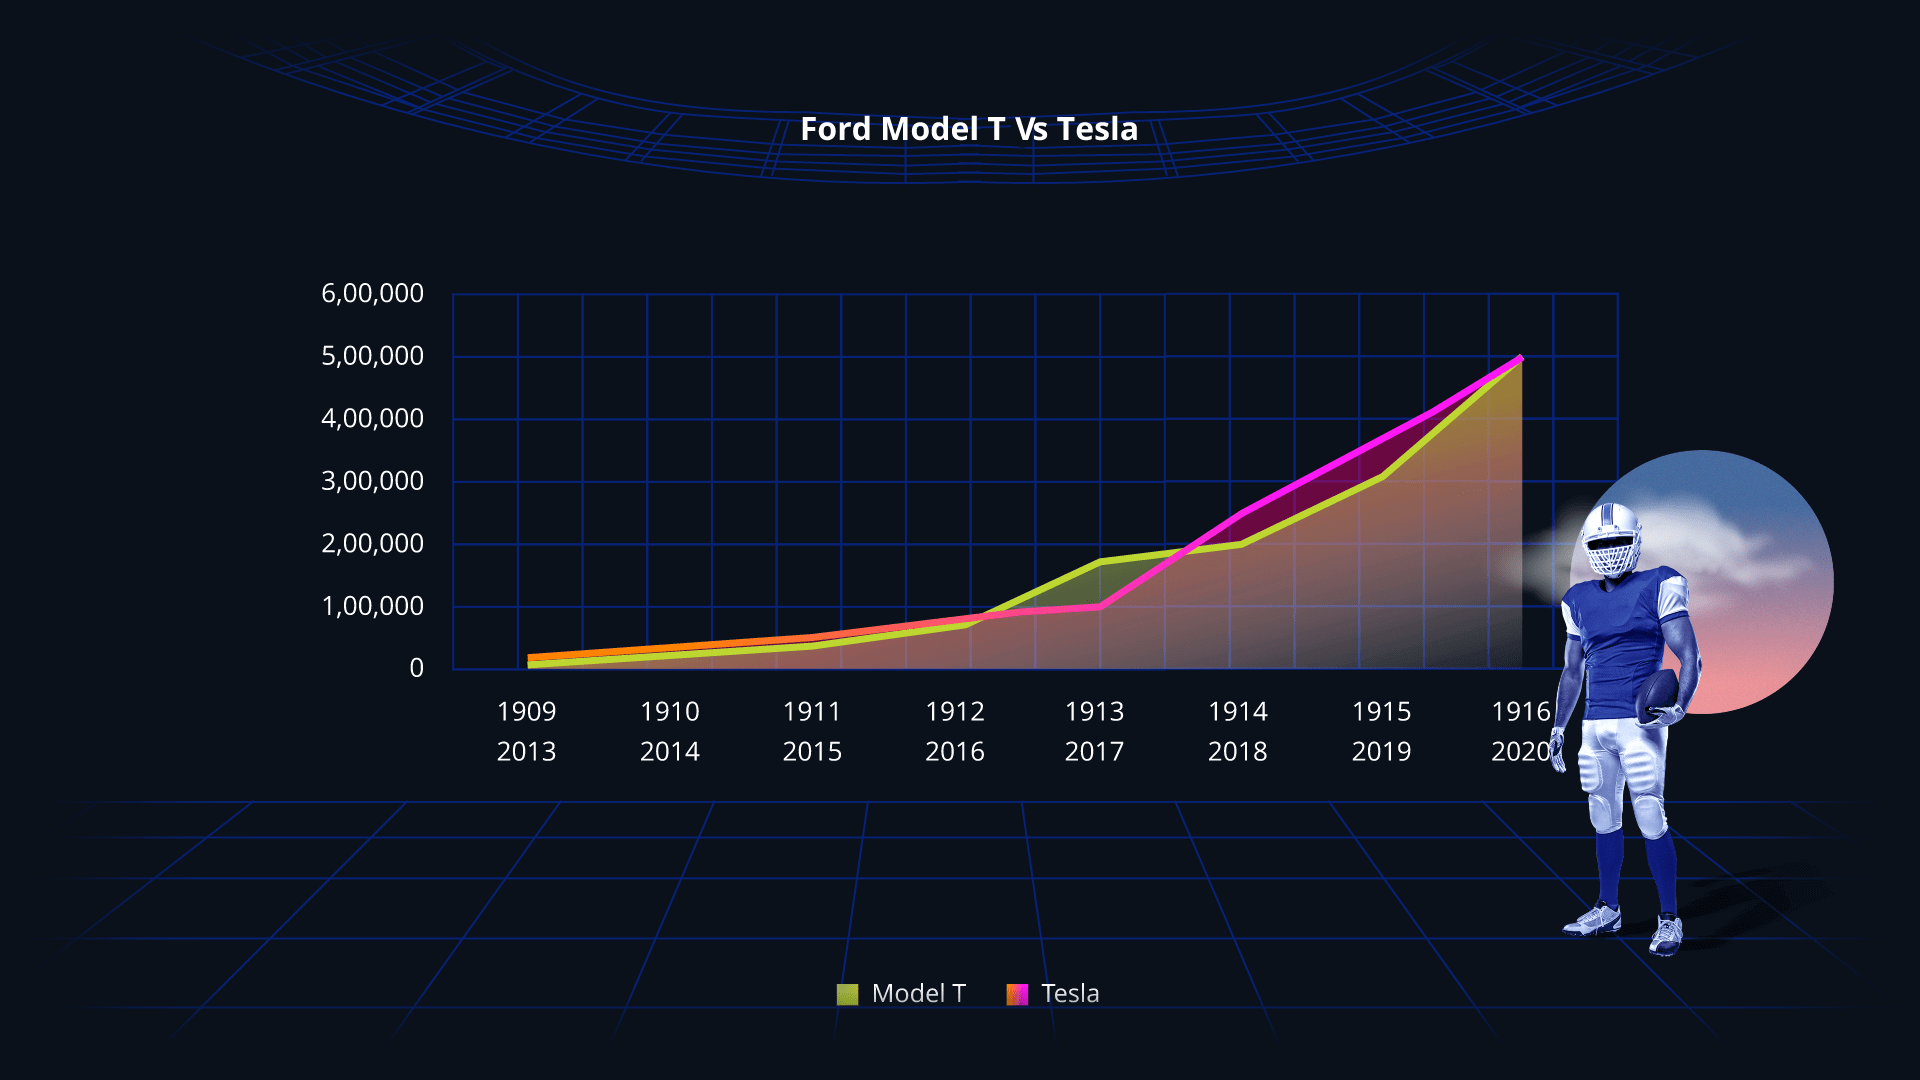
While there is an interesting correlation between the production of Model Ts and the production of Teslas, these operations' scale is very different. The original Model T factory was the largest in the world at 60 acres, and today it is dwarfed by the 121 acre Tesla factory. Whereas a Model T could be produced in 5 hours and 56 minutes and would costs $825 ($23,763 PDV)11, a Tesla takes 10 hours and costs between $44,900 - $146,49012.
One of the fundamental differences between the Model T and the Tesla is engineering complexity, with a Tesla comprising over 10,000 parts compared to just 1,481 of the Model T.
Automation, digitalization, and engineering excellence are essential to North American automotive success and capitalize on a growing global market while the domestic market remains slow. This factor will also require North America to accelerate and compete in creating giga factories.
Is consumer attitude toward sustainability leading North America to miss a significant market opportunity?
Global opportunity or Domestic behavior
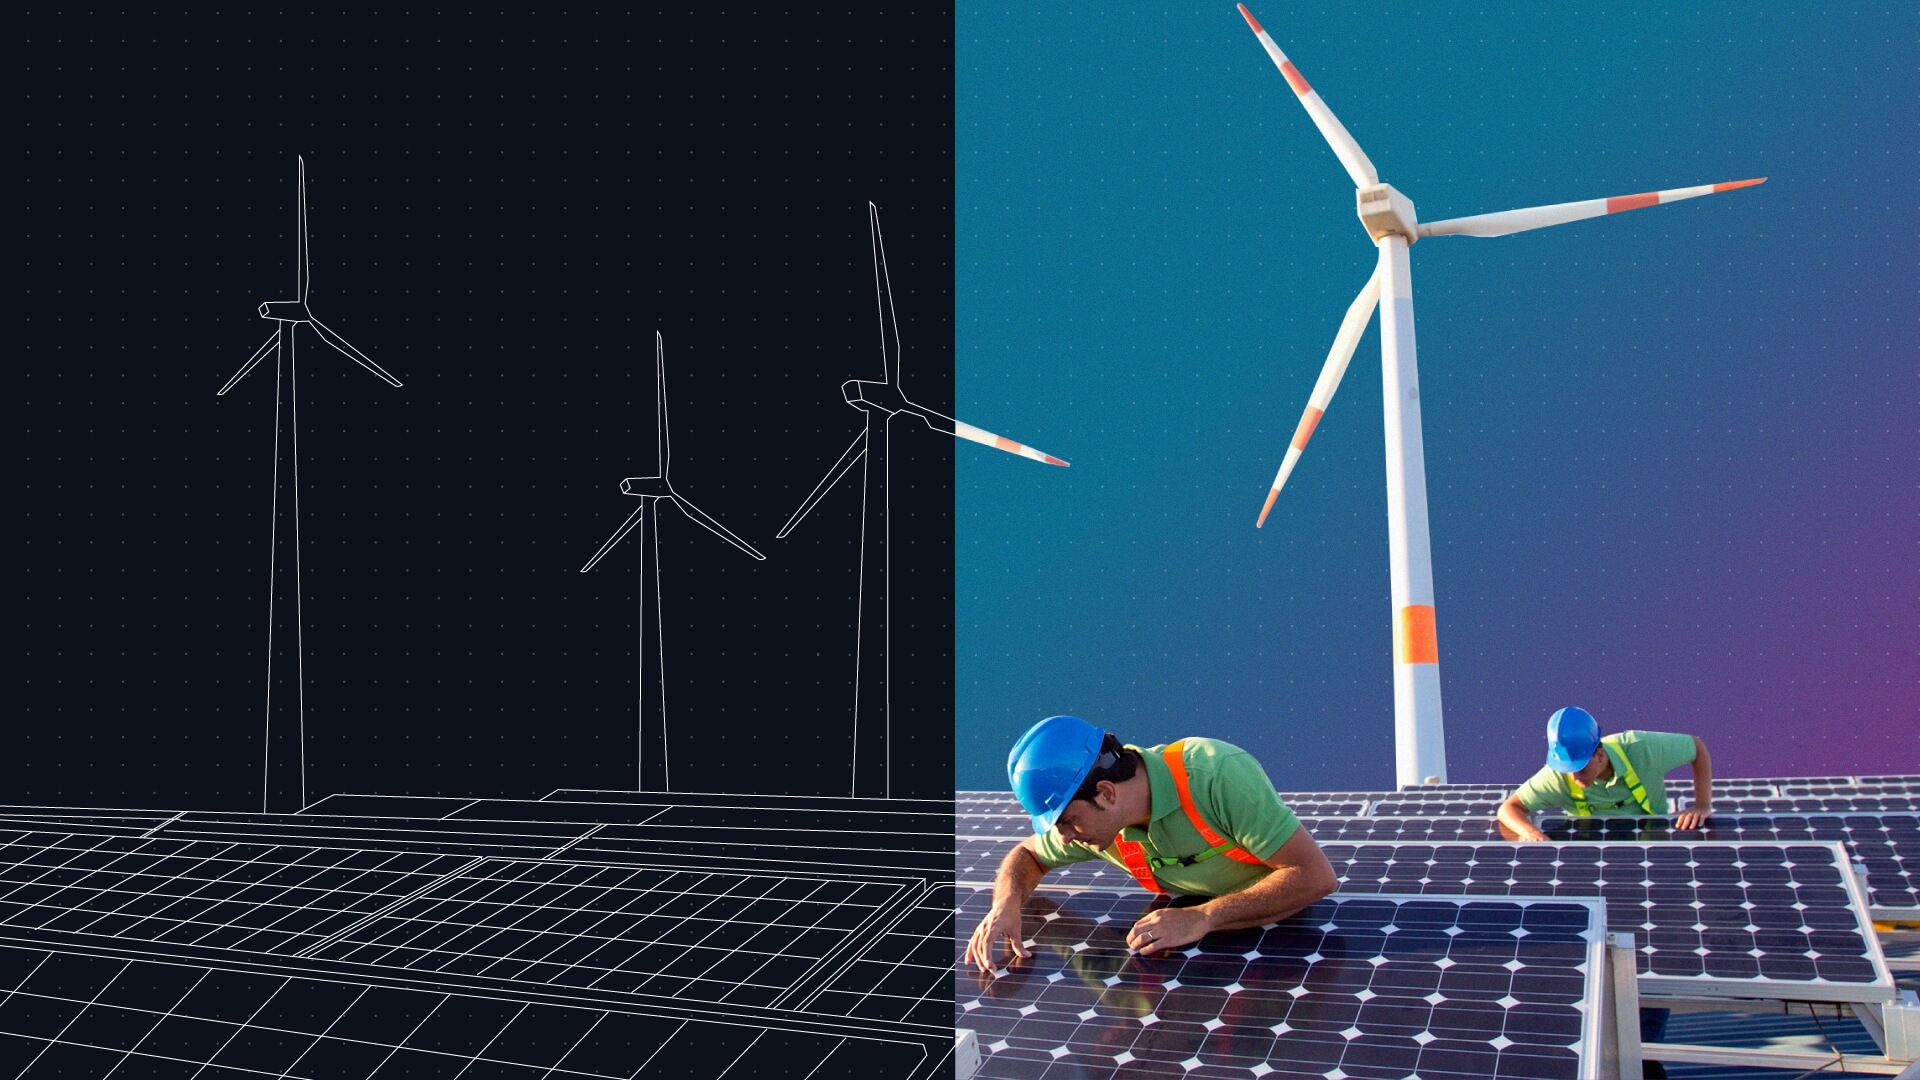
The Global Renewable Energy Market reached $881 billion in 202016 and is estimated to grow to $1,977 billion in 2030. This is a major opportunity but will North America claim its share of this market, or is consumer behavior holding them back?
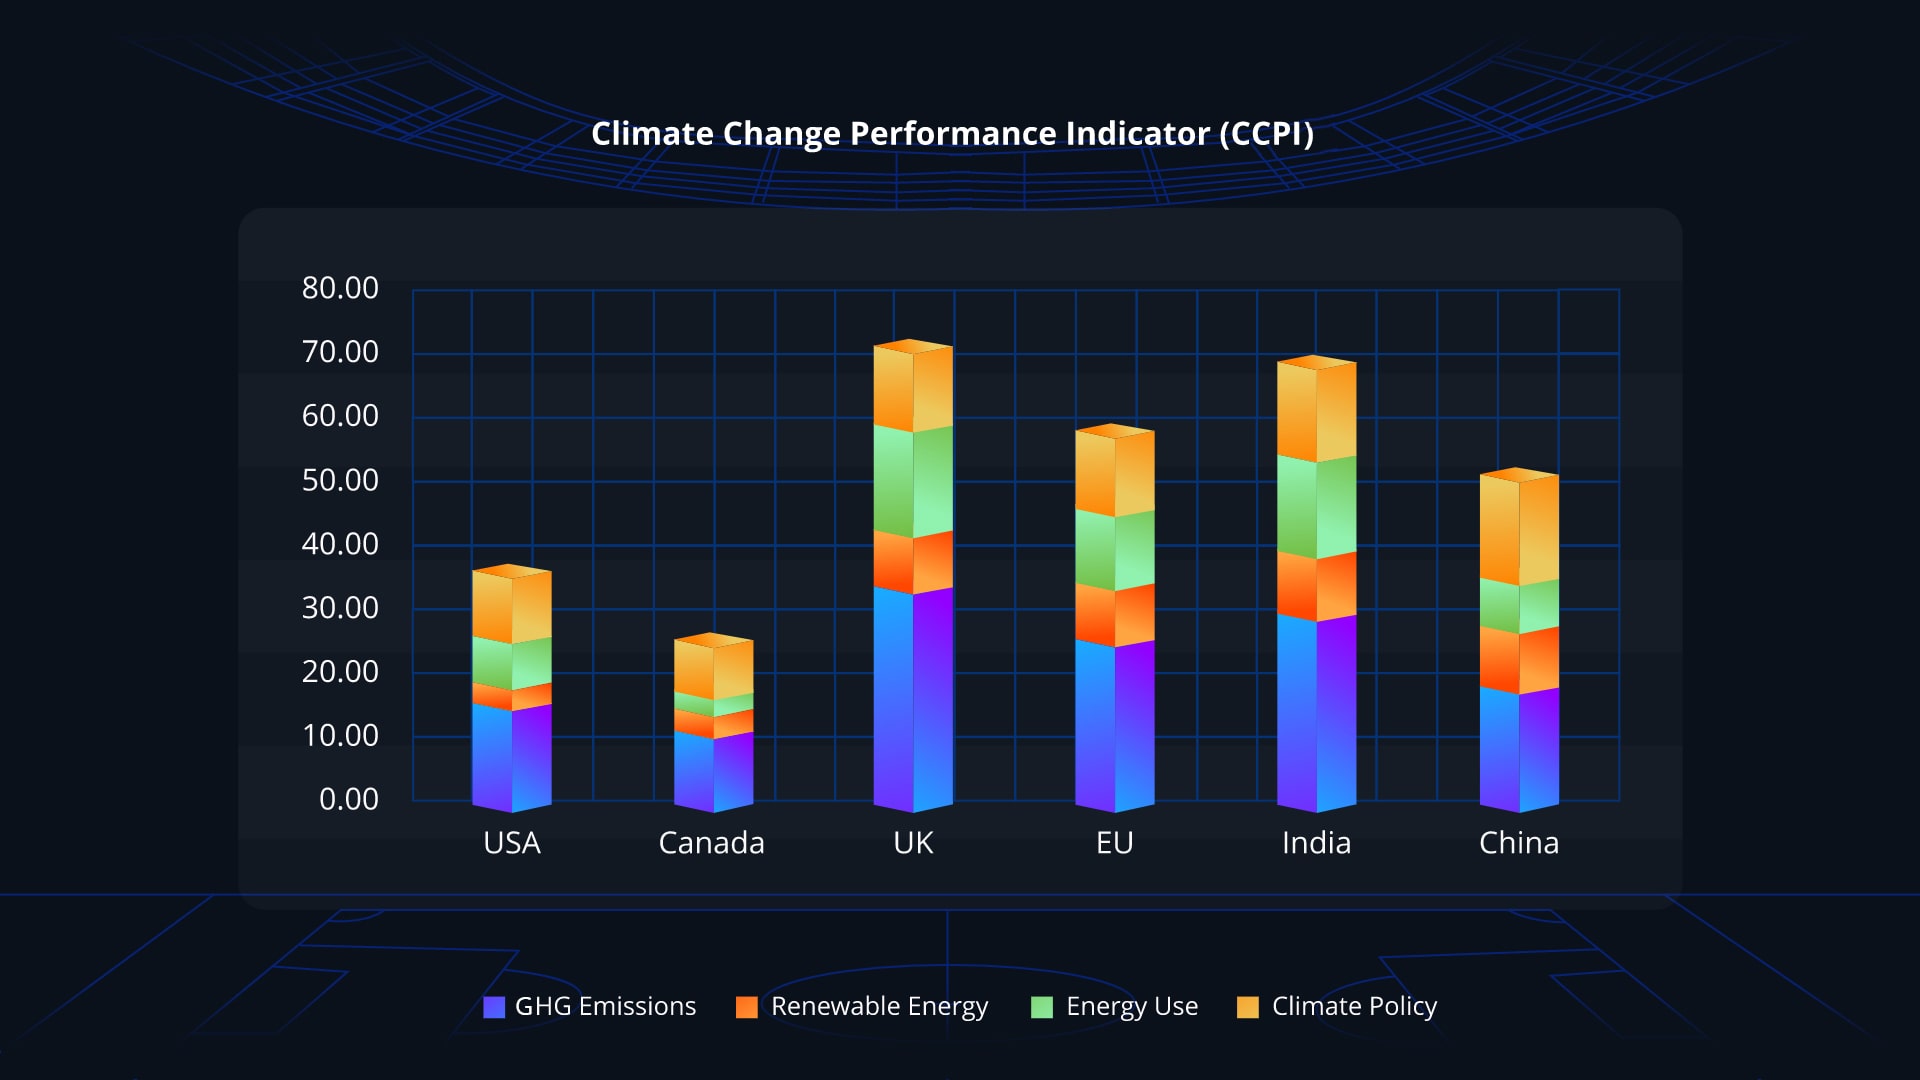
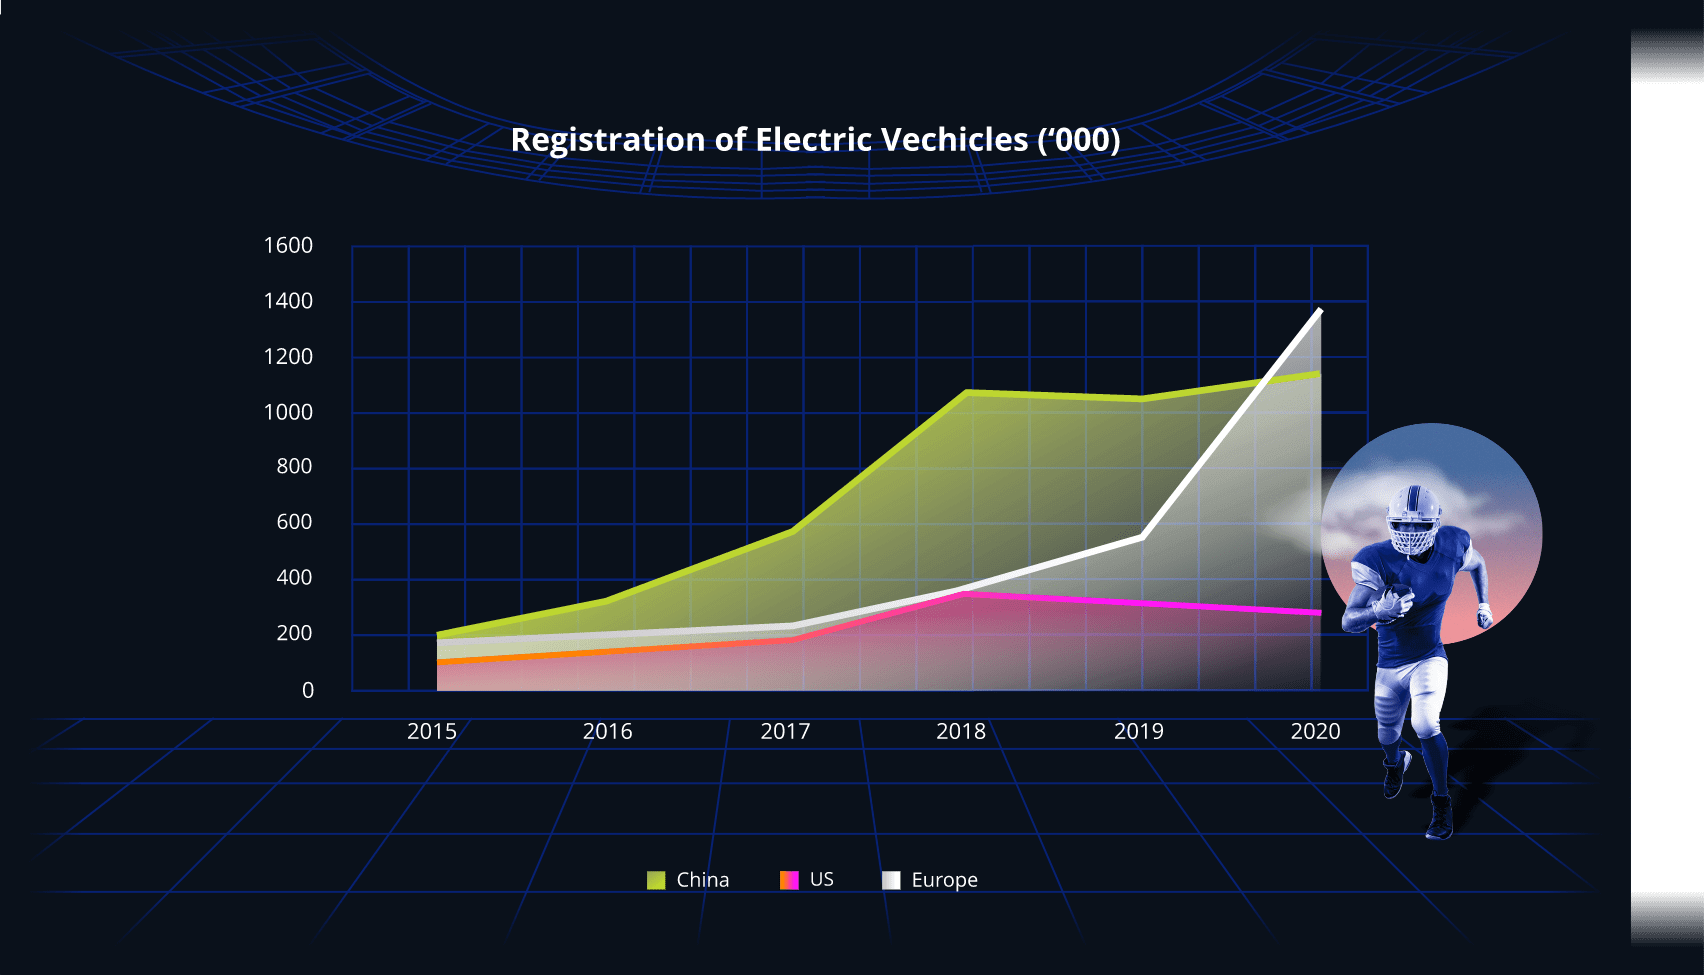
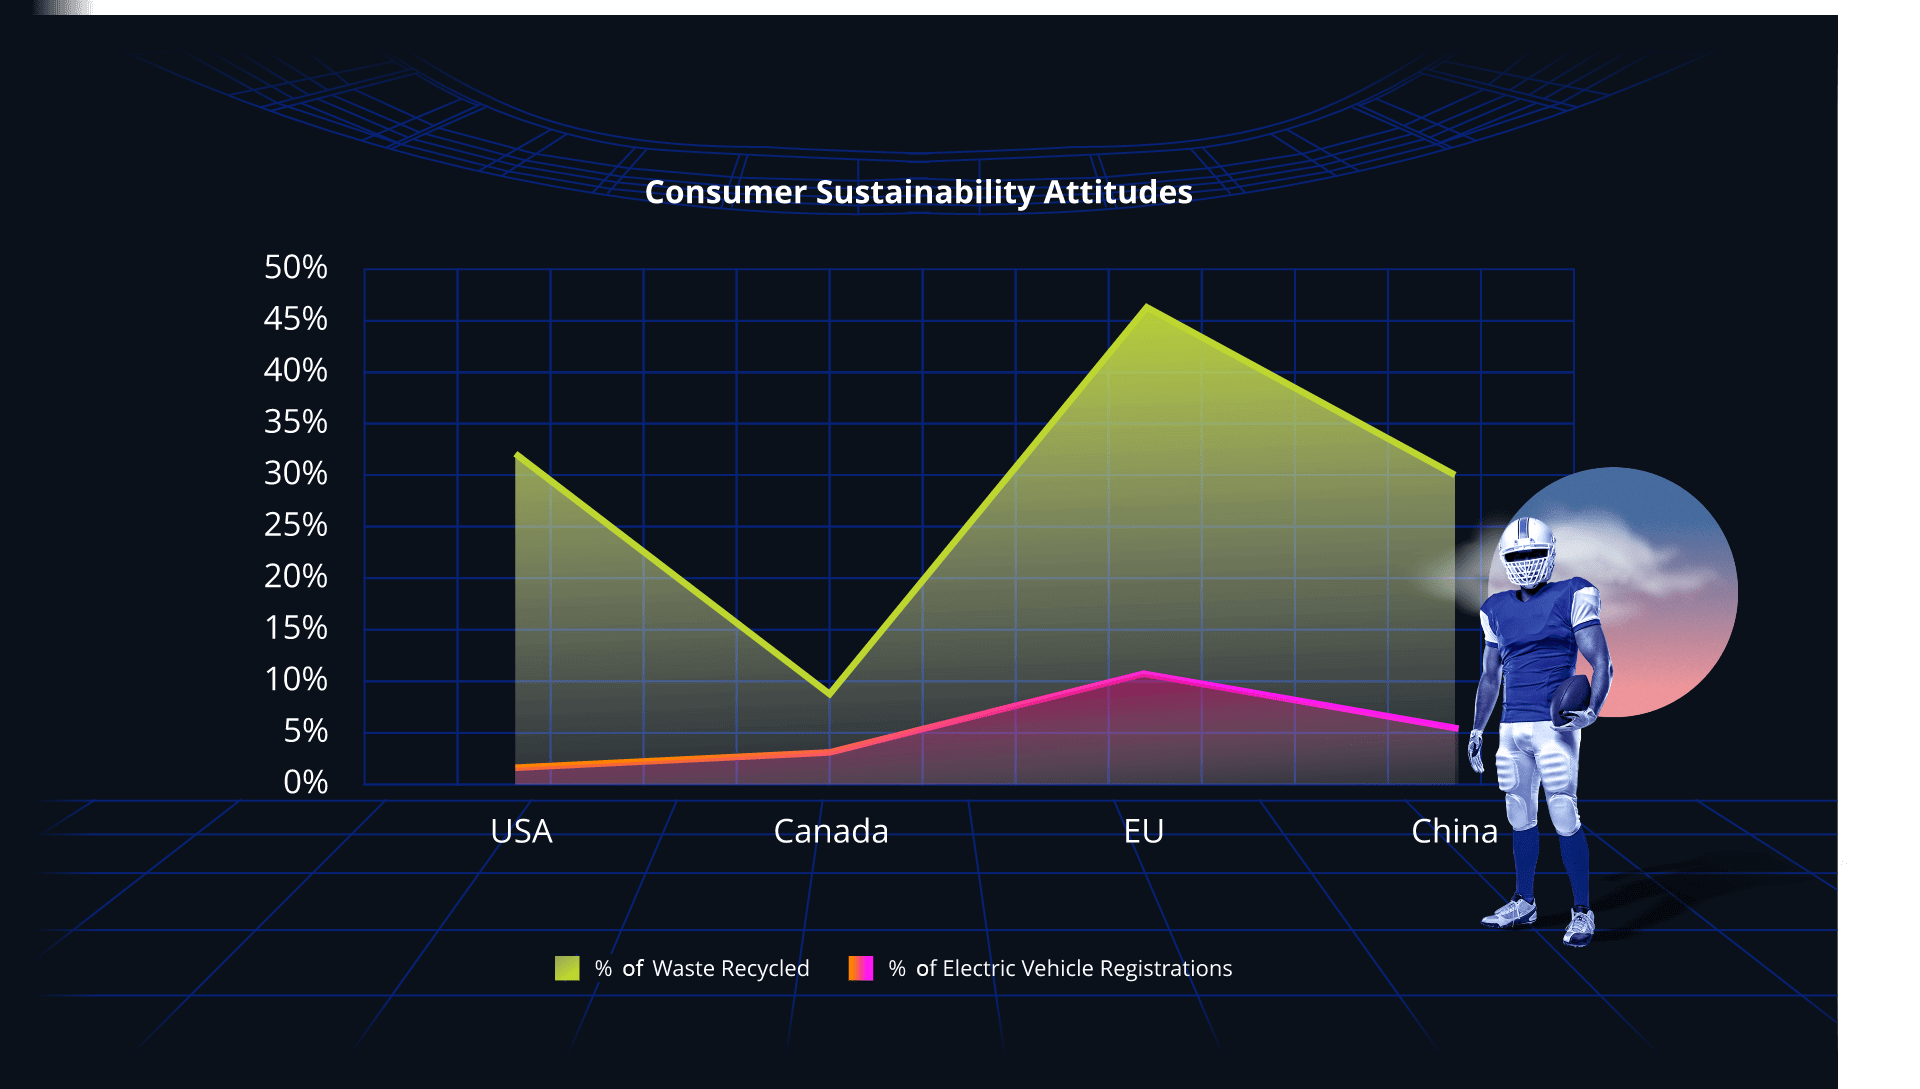
The Climate Change Performance Indicator (CCPI)17 is a good indicator of the green agenda of countries. North America does not perform well, with the USA ranked 55th globally and Canada at 61st. If we then look at two consumer indicators, the percentage of waste recycled and the rate of electric vehicle registrations, North America is far lower than the EU, India, and China.
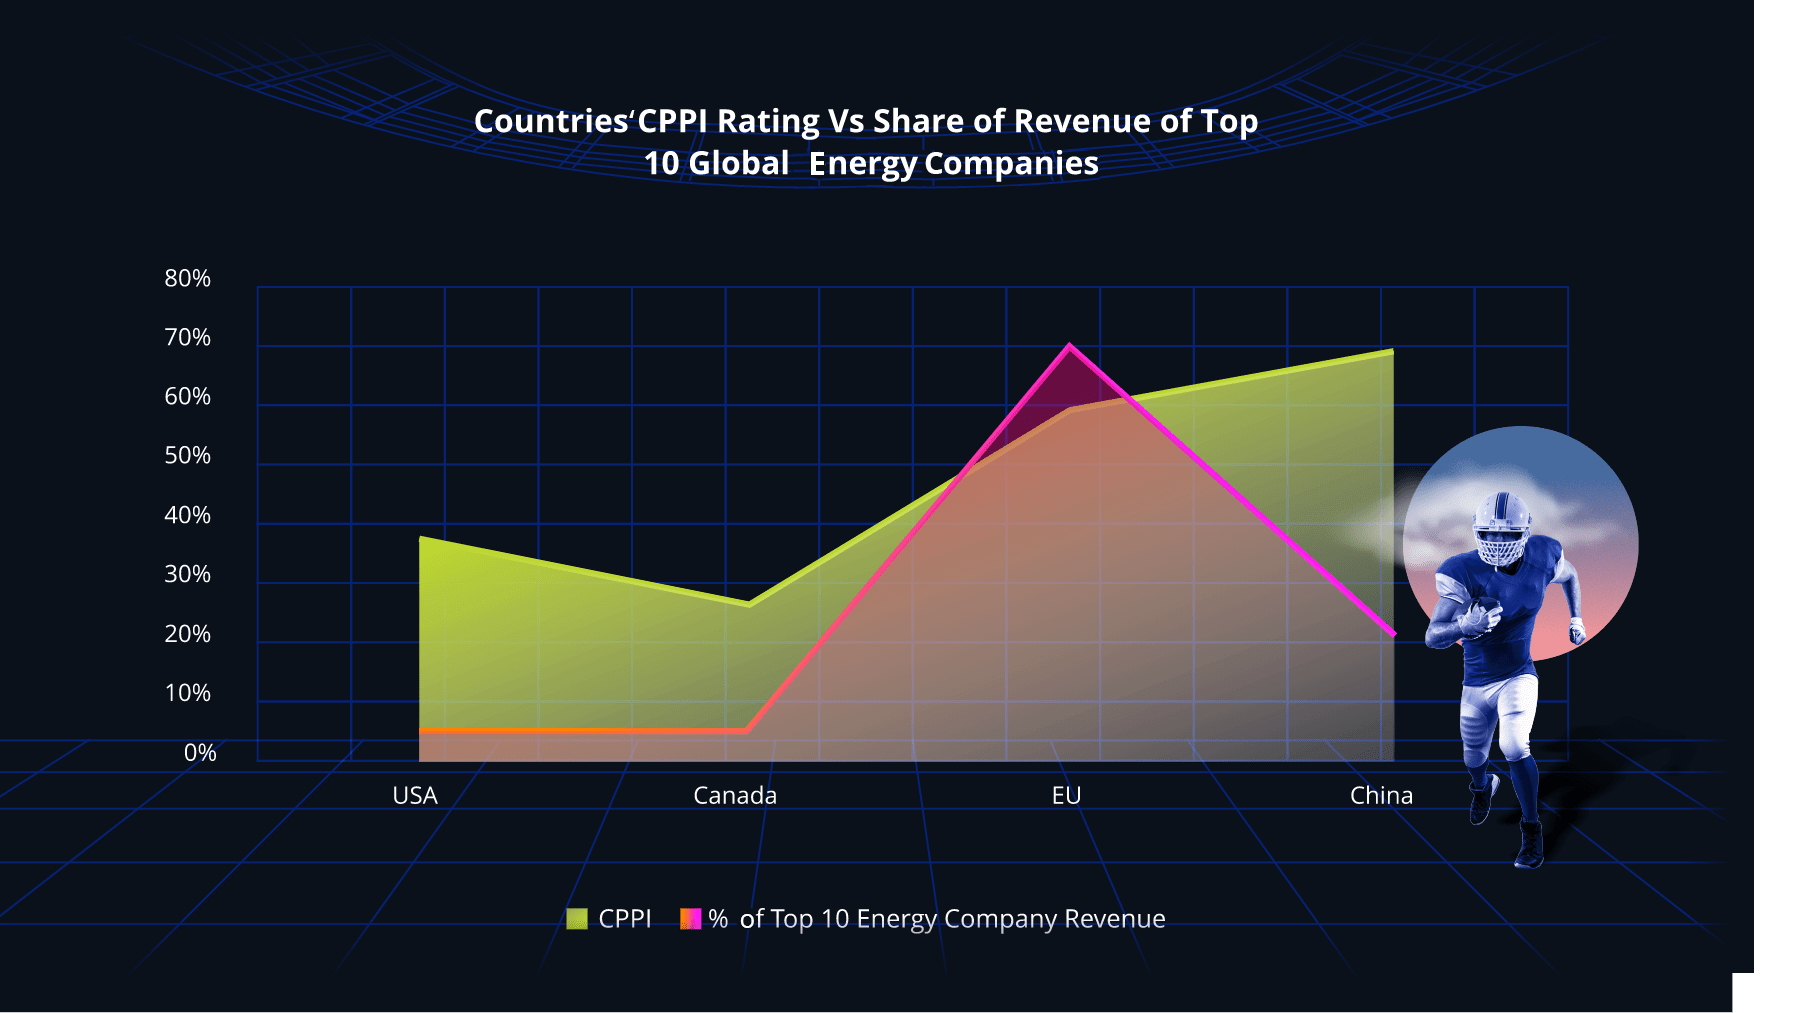
Both the CCPI and consumer indicators correlate with the country's success in the global renewable energy market. The USA has only a 5% share of the revenue generated by the top 10 global renewable energy companies18 and Canada at 4%.
The sustainability market is a significant opportunity for both countries, however, it is yet to be determined whether it is a domestic attitude or global demand that will drive success.
Is global dominance in
MedTech driven by REGIONAL POPULATION

Or talent, innovation, and investment?

Domestic demand
or talent & innovation
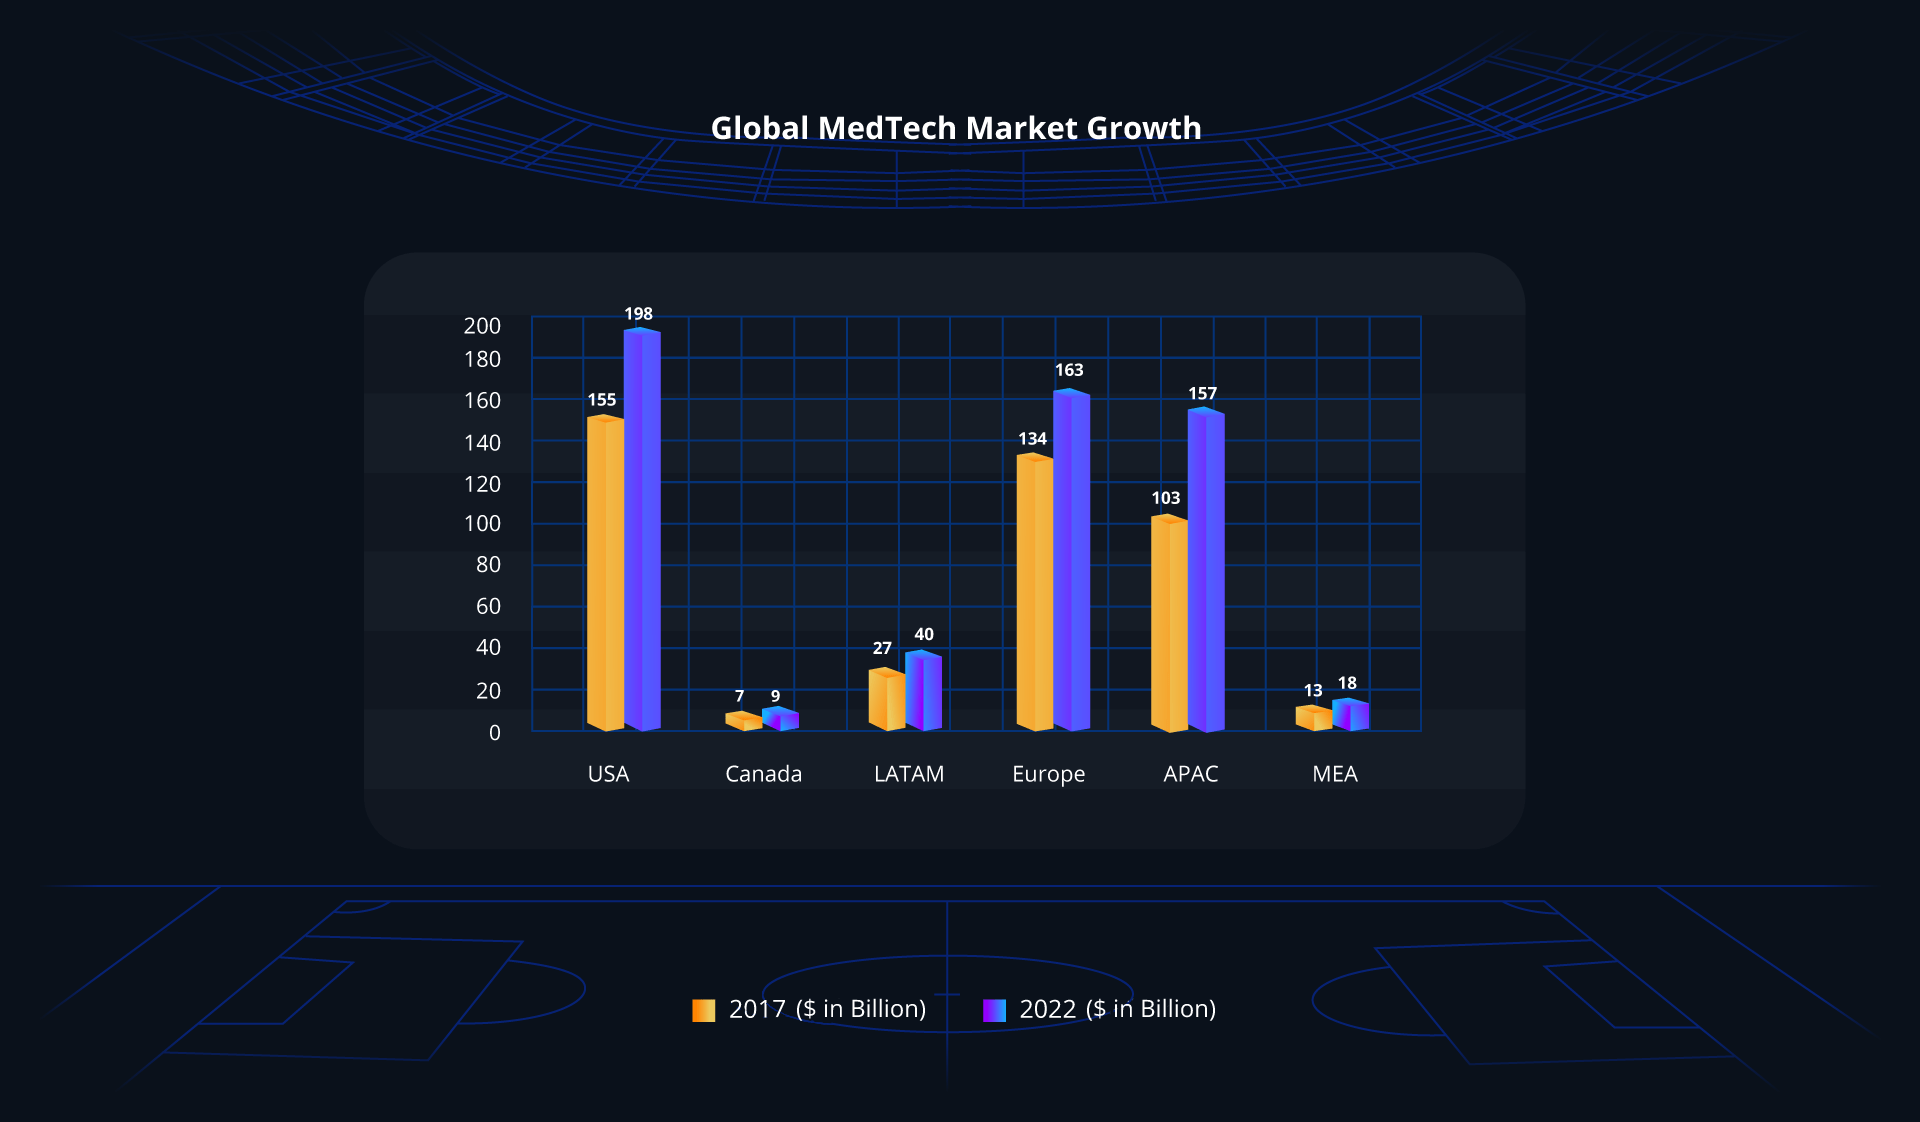
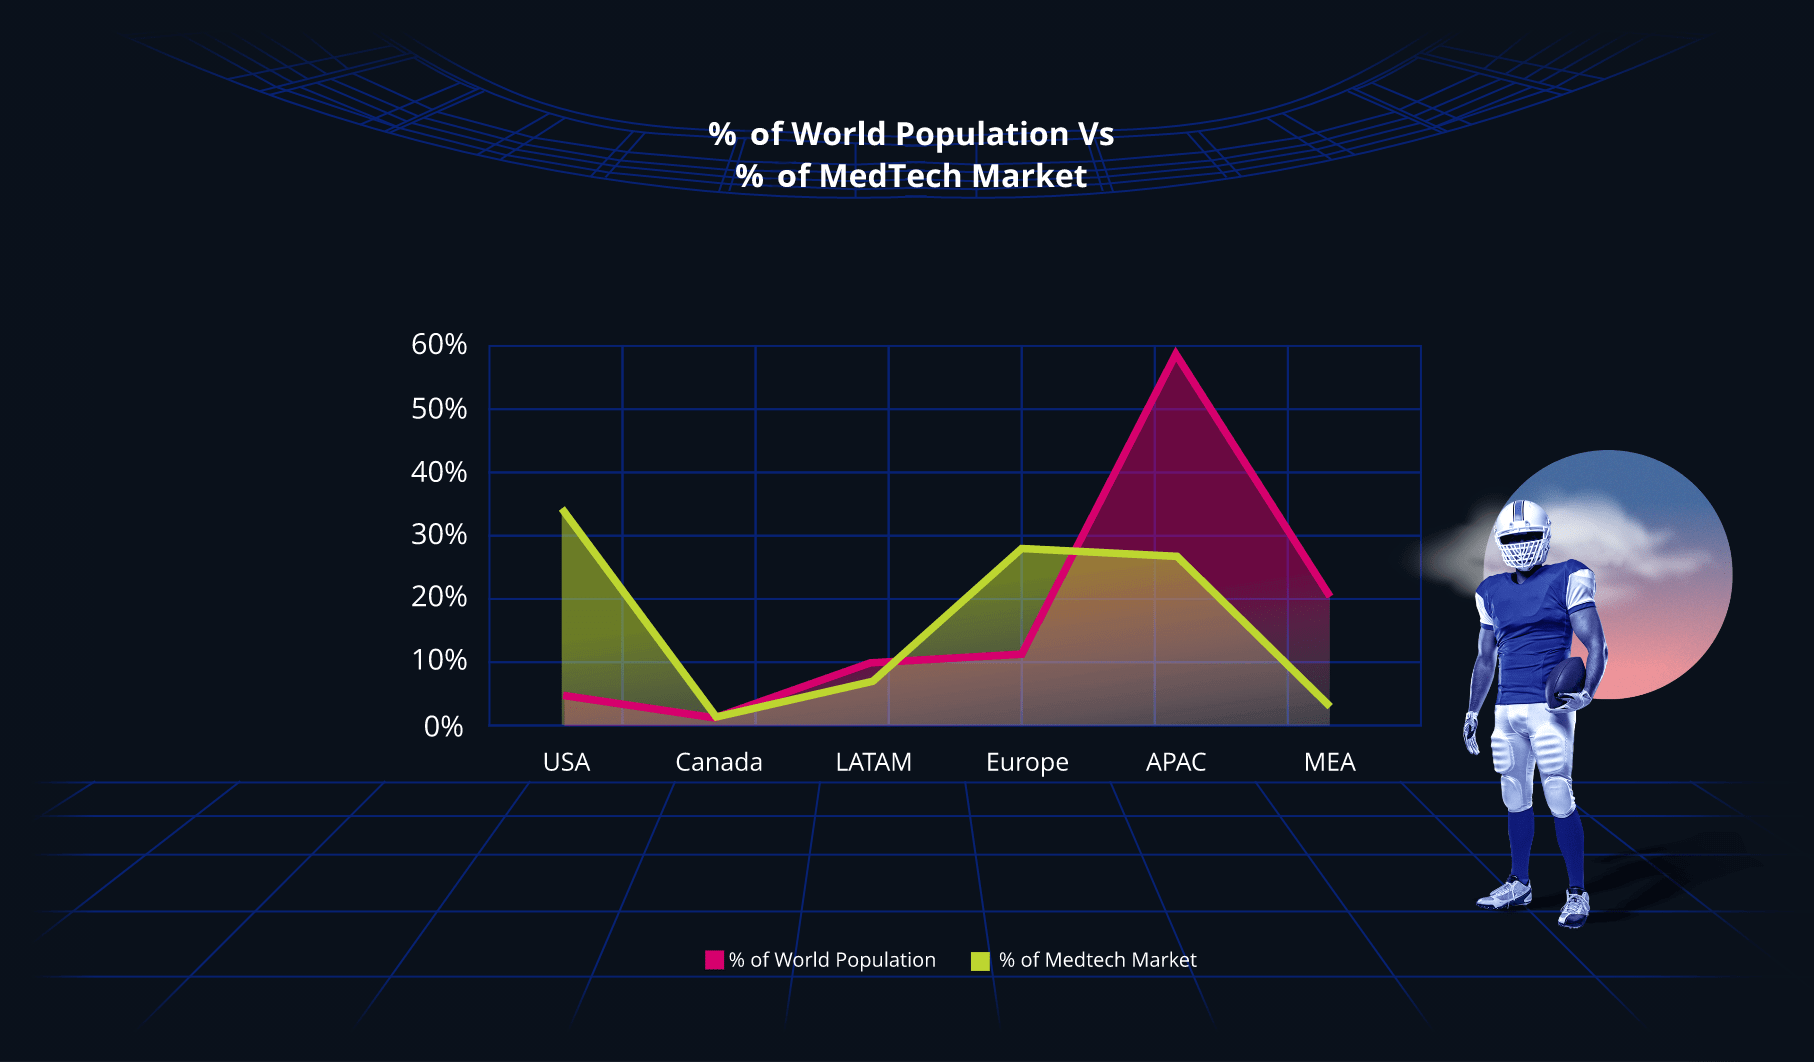
In 2022, the global MedTech market is estimated at $585 billion, led by North America, valued at $207 billion20.
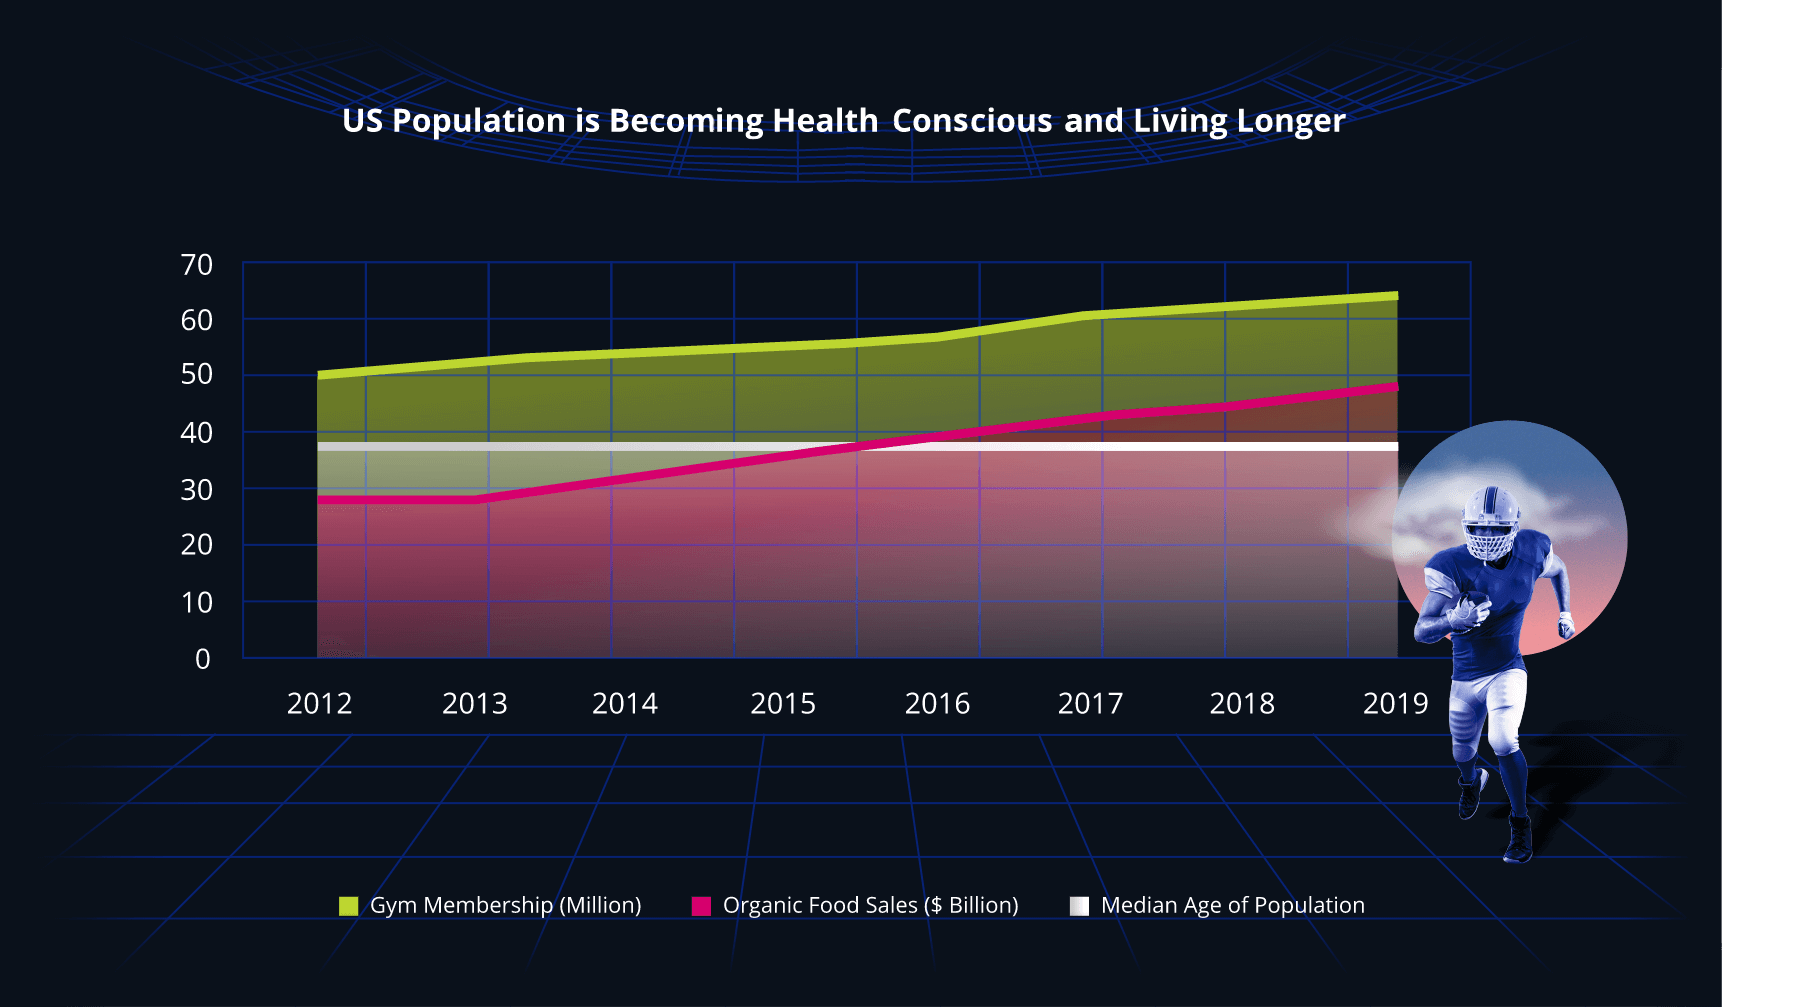
Although there is a direct correlation between people keeping fit, eating healthier, and the median age of the population, this alone does not constitute the 6% CAGR notiched in the MedTech market.
Whereas you would think that the size of the MedTech market would directly correlate to population size, this is not the case. North America and Europe combined only have 15% of the world’s population, yet they have a 64% share of the global MedTech market.
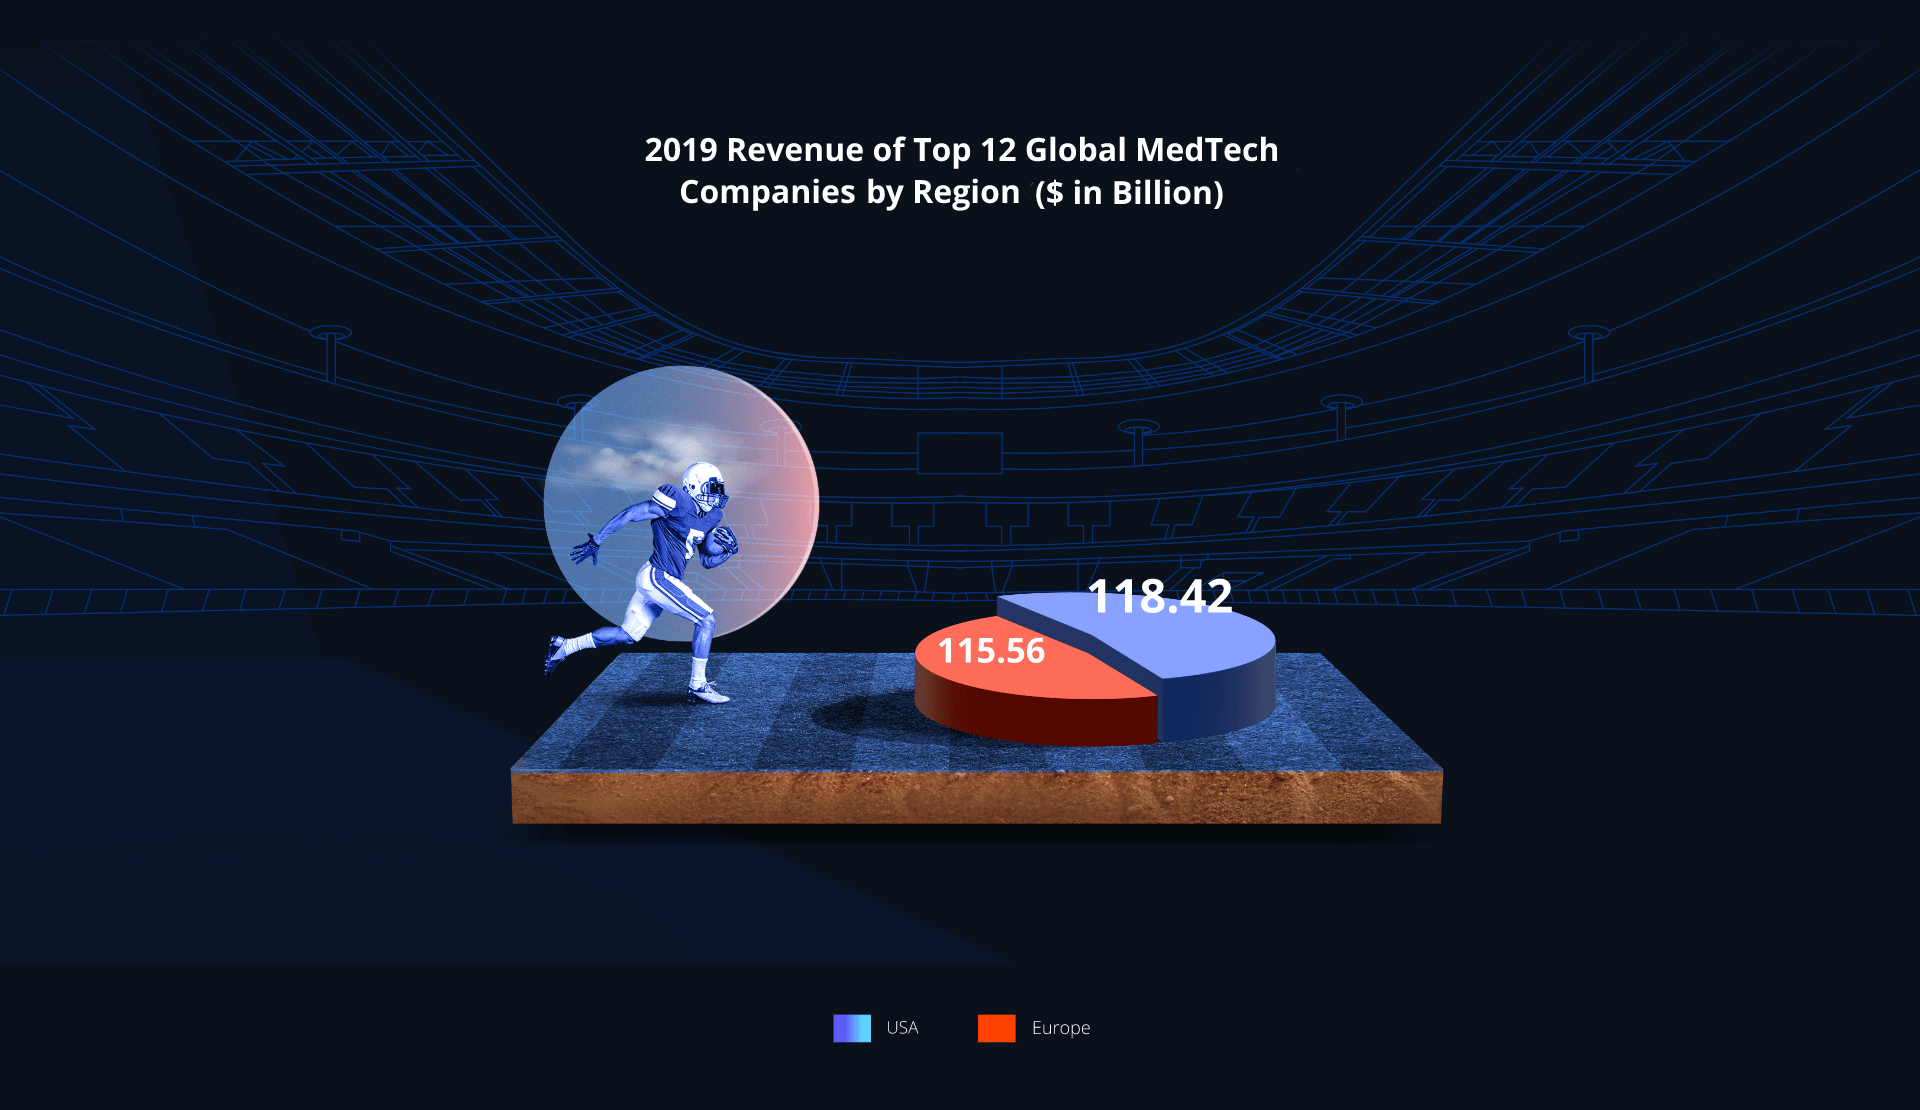
Dominance and growth in MedTech is more about talent, investment and innovation rather than domestic demand alone, shown by the fact that the top 12 global MedTech companies are either in North America (7) or Europe (5), and the revenue of these companies is evenly split at 51% and 49% respectively between these two regions.
This global dominance in MedTech by North America is a solid foundation to further innovate and capitalize on a growth market.
Is growth in the US wireless industry driven by Social Media

And will this accelerate the adoption of 5G?

Social media explosion vs wireless growth
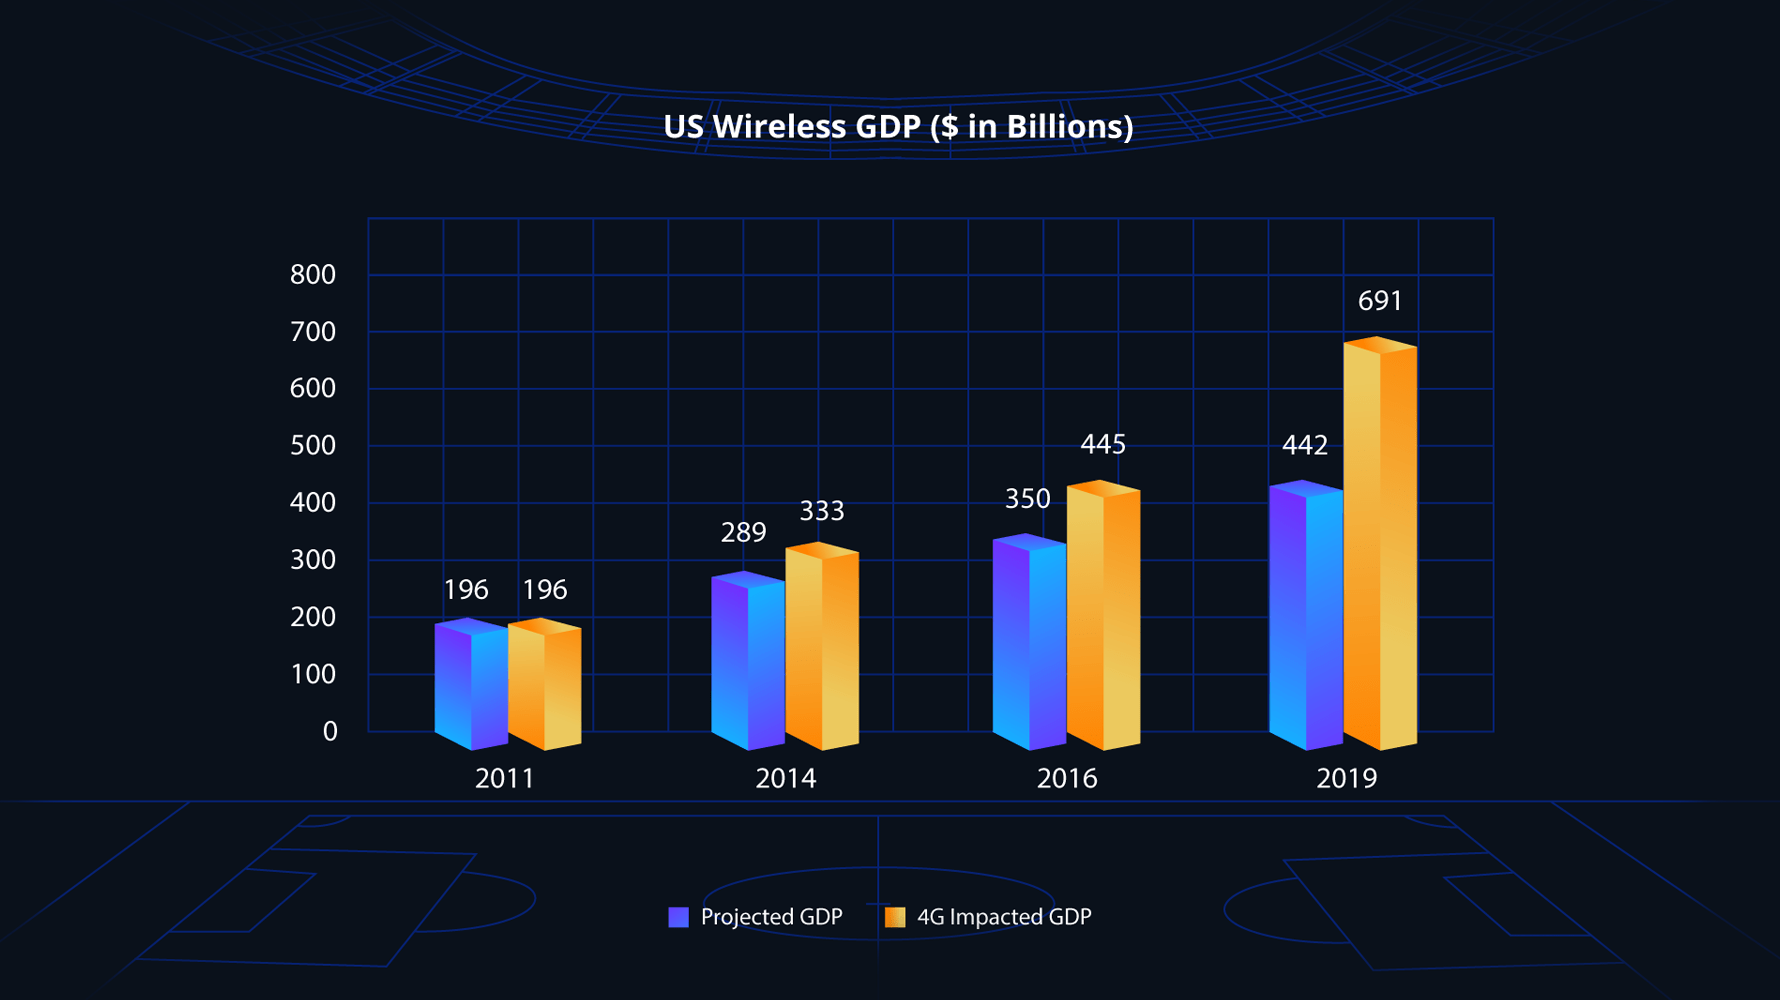
America’s world-leading 4G network fuelled significant growth in the wireless market. During the 4G decade, the US wireless GDP grew by 253% to $690.5B, while wireless industry jobs increased by 440% to 20.4M and accounted for 10% of the growth in the US GDP24.
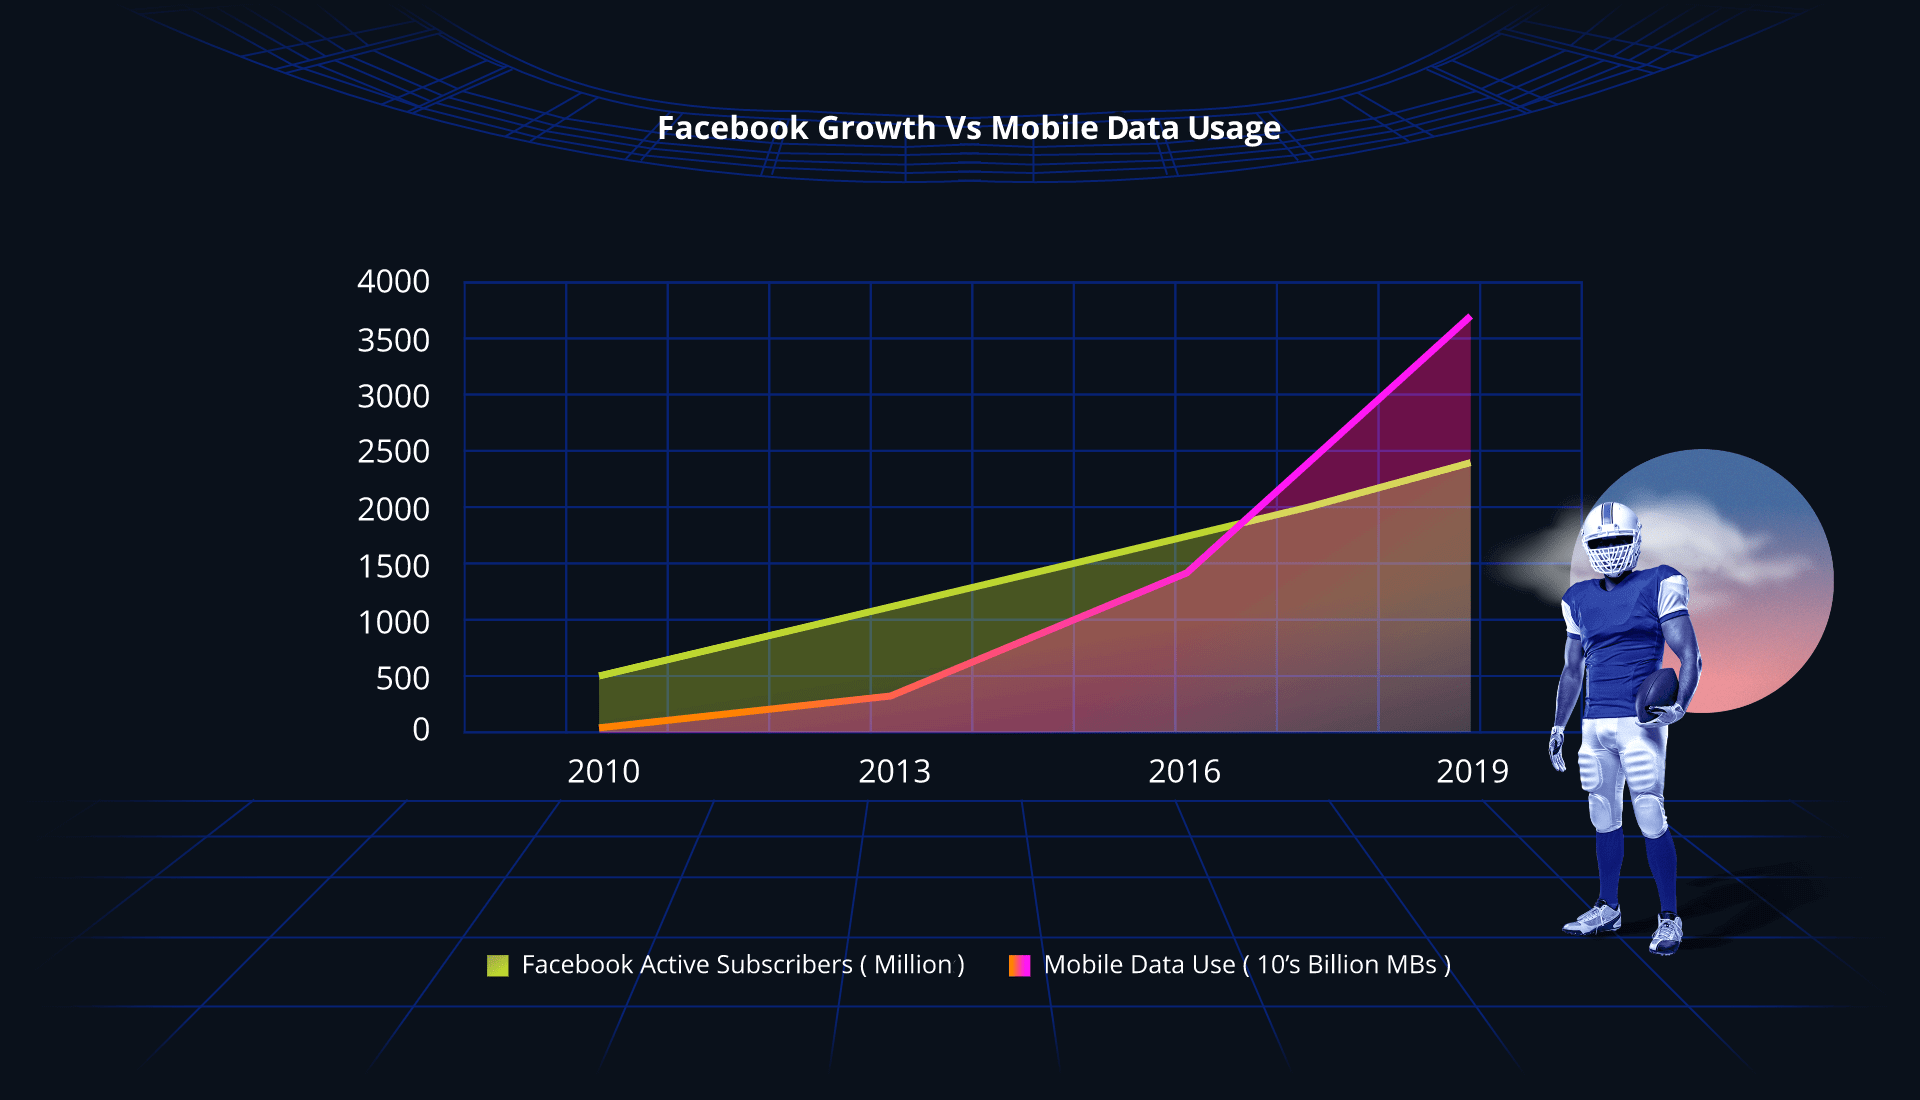
Coinciding with this period has been the explosion of social media on the global landscape. There is a clear correlation between the growth of Facebook active users alone and mobile data consumption. Is social media driving this growth, or did greater bandwidth at a lower cost make social media more attractive?
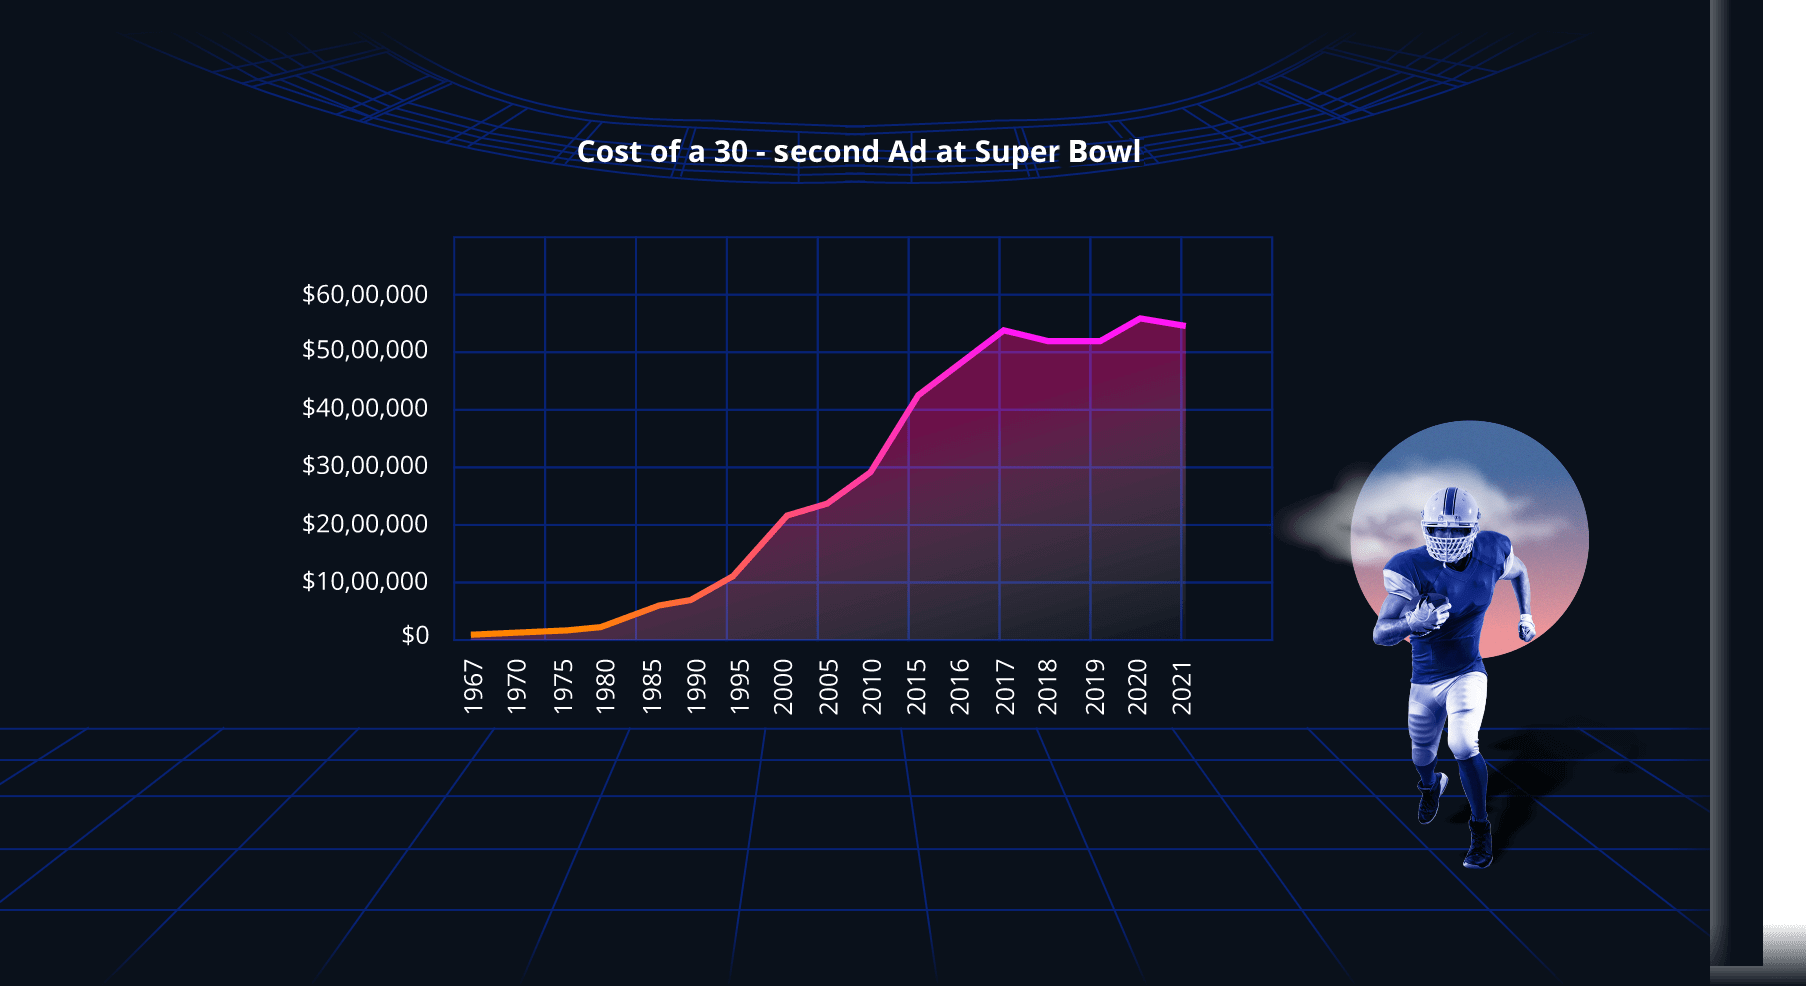
Back to the Super Bowl, and a great measure of the power of media is the cost of the 30-second half-time advert. What is interesting is to see the correlation of this with the revenue growth of the streaming media industry.
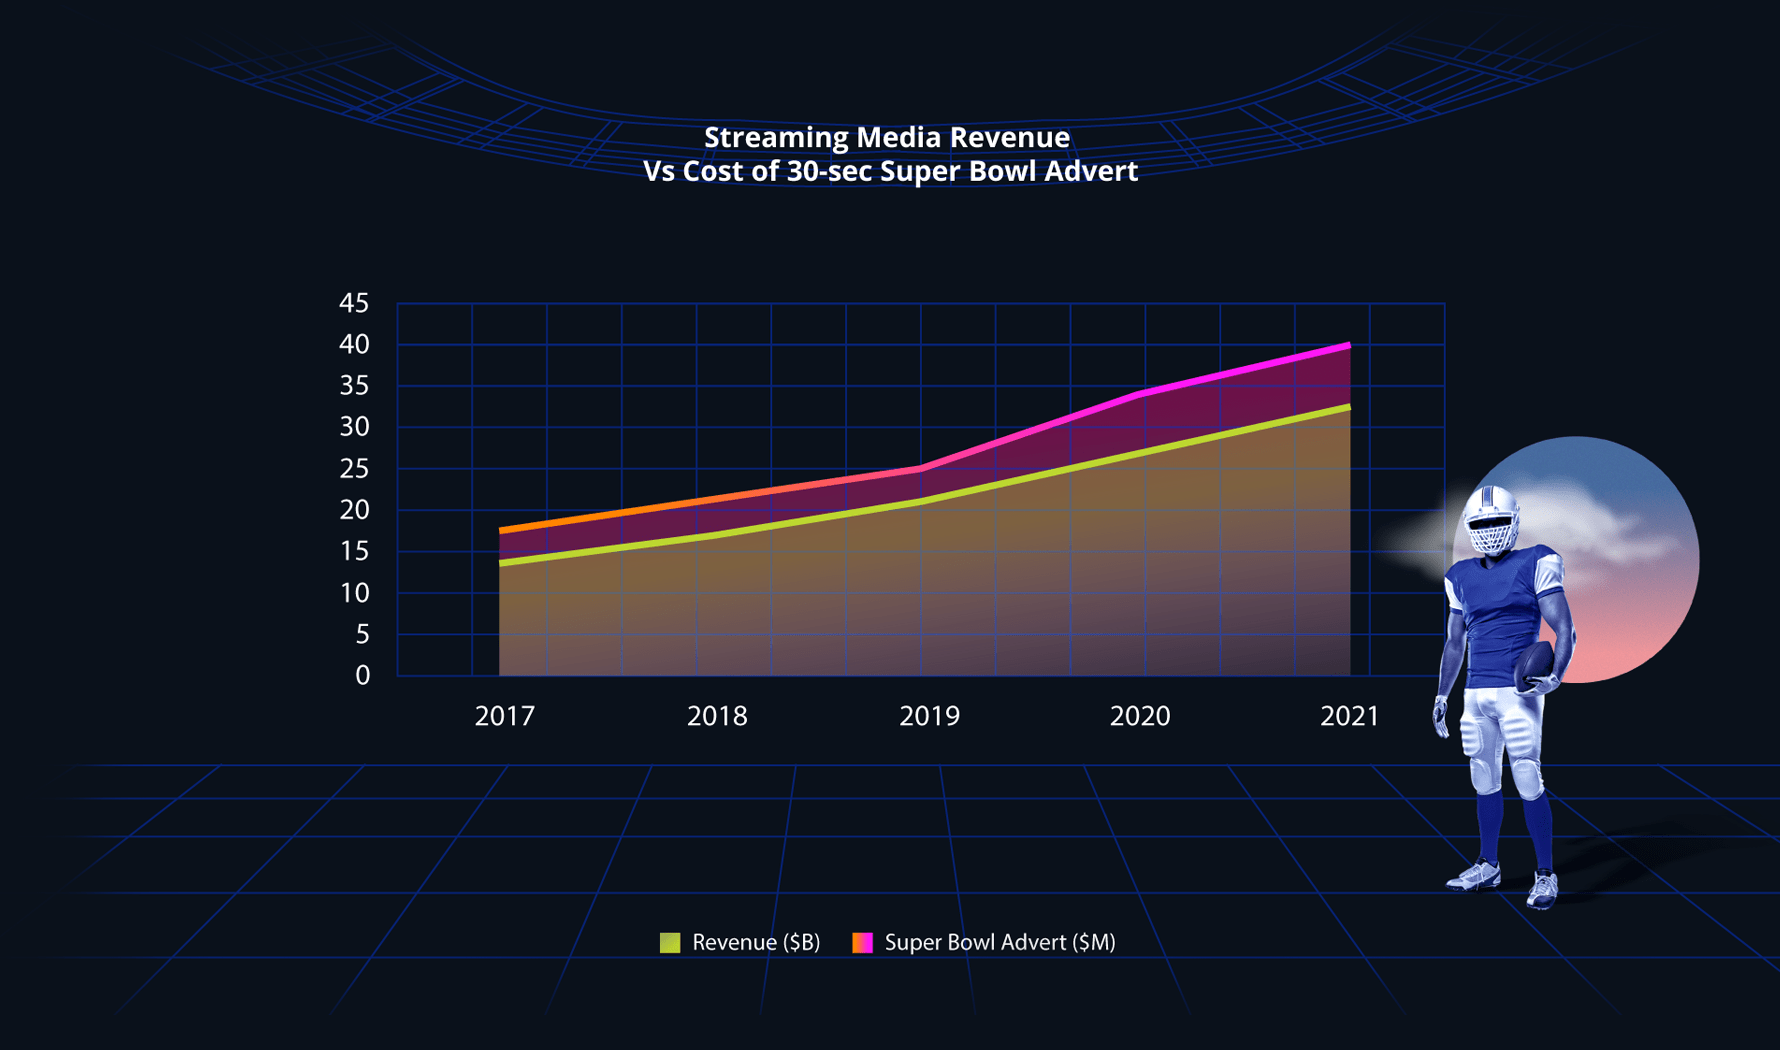
When you combine the fact that the average American spends 2 hours and 24 minutes on social media a day30 with figures that show around 78% of the US population subscribed to streaming media27, it is not a case of cause and effect, but technology and demand combining to fuel the past growth in 4G and the anticipated impact of building a flourishing 5G economy.

In Conclusion
Taking a concept and turning it into something highly successful is what North America has proven time after time - from the Model T to Tesla, from the Super Bowl to Silicon Valley.
Investment in talent, innovation, and start-ups are essential factors that have driven unfair advantage and dominance in key industries, demonstrated by the correlation of global 100 companies in North America and Unicorns. Where this is set to fuel significant growth in the areas of MedTech and 5G, will it be sufficient to establish leadership positions in the Electric Vehicle market and the significantly important world of sustainability and renewable energy?
The ten world records in athletics held by North America resulted from combining talent with science to drive the best possible performance, and these two factors will be critical in shaping the future of this region.